3
$\begingroup$

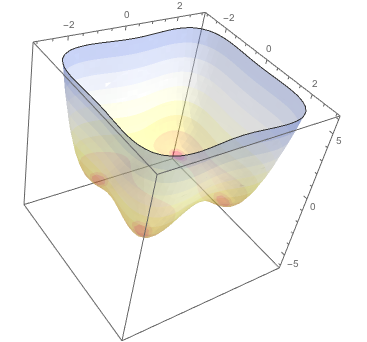
Basically, I want to make this 3-D Plot transparent. I've already tried Opacity[]. I also want to change its color to e.g. light blue.

α= 1;
β= 1;
tmp = 0.1316;
ρ= 0.01;
t = -1.5;

fe[m_, p_] := 
 1/2*(t - 1)*p^2 + 1/4*p^4 + (1/2*\α^2*β*m^2*(t - tmp)) + 
  1/4 α^2*(β)*(m^4) + 1/2*(\ρ*(p^2)*(m^2))

Show[SliceContourPlot3D[-z, 
  z == fe[m, p], {m, -3, 3}, {p, -3, 3}, {z, -6, 6}]]

enter image description here

$\endgroup$
4
  • $\begingroup$ By the way, why use SliceContourPlot3D when Plot3D will do? $\endgroup$
    – user484
    Commented Apr 18, 2016 at 19:38
  • $\begingroup$ it will return to some error @Rahul $\endgroup$
    – Nabil
    Commented Apr 18, 2016 at 19:38
  • $\begingroup$ What error do you get with Plot3D[fe[m, p], {m, -3, 3}, {p, -3, 3}]? $\endgroup$
    – user484
    Commented Apr 18, 2016 at 19:41
  • $\begingroup$ It works, but somehow it shown different 3-D Graph. @Rahul $\endgroup$
    – Nabil
    Commented Apr 18, 2016 at 19:43

3 Answers 3

9
$\begingroup$

You can use ContourShading with Directives to achieve both.

 α = 1; β = 1; tmp = 0.1316; ρ = 0.01; t = -1.5; 

    fe[m_, p_] := 1/2*(t - 1)*p^2 + 1/4*p^4 + (1/2*α^2*β*m^2*(t - tmp)) + 
      1/4 α^2*(β)*(m^4) + 1/2*(ρ*(p^2)*(m^2)) ; 

 SliceContourPlot3D[-z, z == fe[m, p], {m, -3, 3}, {p, -3, 3}, {z, -6, 6}, 
          ContourShading -> Directive[Red, Opacity[0.5]]]

Mathematica graphics

$\endgroup$
2
  • $\begingroup$ can we remove the contour line? @RunnyKine $\endgroup$
    – Nabil
    Commented Apr 18, 2016 at 19:35
  • 1
    $\begingroup$ @Nabil Yes. Add Contours -> None $\endgroup$
    – RunnyKine
    Commented Apr 18, 2016 at 19:37
9
$\begingroup$

You can add transparency to a color function. No need to make the whole plot to have one color.

Show[SliceContourPlot3D[-z, 
  z == fe[m, p], {m, -3, 3}, {p, -3, 3}, {z, -6, 6}, 
  ColorFunction -> 
   Function[{z}, Opacity[0.4, #] &@ColorData["TemperatureMap"][z]], 
  ContourStyle -> None]]

enter image description here

$\endgroup$
4
  • $\begingroup$ +1. I like your ColorFunction approach. $\endgroup$
    – RunnyKine
    Commented Apr 18, 2016 at 20:58
  • $\begingroup$ @RunnyKine I can't figure out how to obtain the default ColorFunction so you can apply Opacity to it. Any ideas? $\endgroup$
    – BlacKow
    Commented Apr 18, 2016 at 21:04
  • 1
    $\begingroup$ The following should give you the ColorFunction: ff = Trace[ SliceContourPlot3D[Exp[-(x^2 + y^2 + z^2)], x^3 + y^2 - z^2 == 0, {x, -2, 2}, {y, -2, 2}, {z, -2, 2}], _Blend &] // Flatten // ReleaseHold. Then: cf = Function[{x}, Blend[x, #] &]@ff $\endgroup$
    – RunnyKine
    Commented Apr 18, 2016 at 21:20
  • $\begingroup$ @RunnyKine it works for this case! I asked a question about general solution. $\endgroup$
    – BlacKow
    Commented Apr 18, 2016 at 22:23
5
$\begingroup$

Perhaps not entirely what you'd want but for fun sake:

Example:

SliceContourPlot3D[-z, z == fe[m, p], {m, -3, 3}, {p, -3, 3}, {z, -6, 6},ContourShading -> None];

Output:

output example

Reference:

ContourShading

$\endgroup$
3
  • $\begingroup$ can perhaps the contour line, we change it into fish net line? @E.Doroskevic $\endgroup$
    – Nabil
    Commented Apr 18, 2016 at 19:47
  • $\begingroup$ ContourStyle[] does not really work $\endgroup$
    – Nabil
    Commented Apr 18, 2016 at 19:51
  • 1
    $\begingroup$ @Nabil I am afraid I am not sure how to achieve this, but I am sure someone else could implement this. There are some brilliant people here, you came to the right place :) $\endgroup$ Commented Apr 18, 2016 at 20:37

Your Answer

By clicking “Post Your Answer”, you agree to our terms of service and acknowledge you have read our privacy policy.

Not the answer you're looking for? Browse other questions tagged or ask your own question.