5
$\begingroup$

http://demonstrations.wolfram.com/HoleInACylinder/

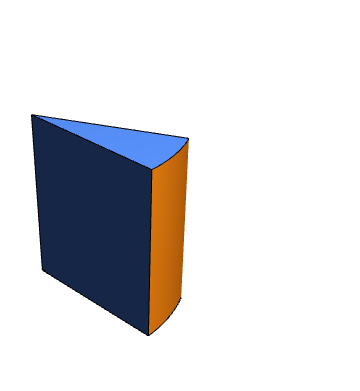
This demonstration uses Graphics3D and is able to generate what I want, but I cant figure out how to separate the simple cylinder plot from the interactive window code. I need to make a simple graphic with specific height, radius, and angle.

Likewise, is there a way to generate such a cylindrical wedge using an integral function with specified bounds to generate a volume? Any help is appreciated, I am brand new to Mathematica and I think this will be quick for someone who knows what they're doing.

$\endgroup$
1
  • 1
    $\begingroup$ I made a function that can do that as part of this answer. It's called ellipse3D $\endgroup$
    – Jens
    Commented Apr 17, 2016 at 2:34

2 Answers 2

8
$\begingroup$

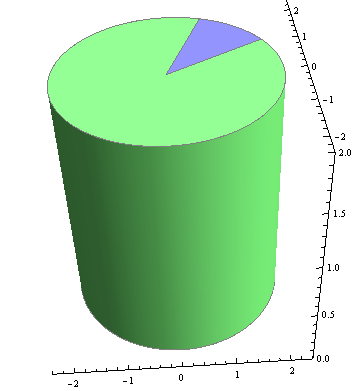
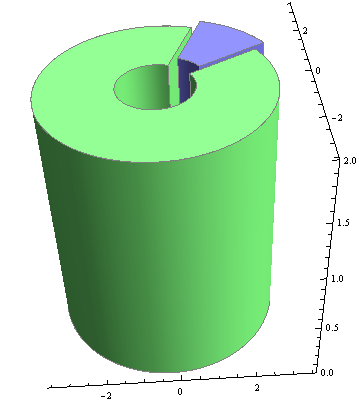
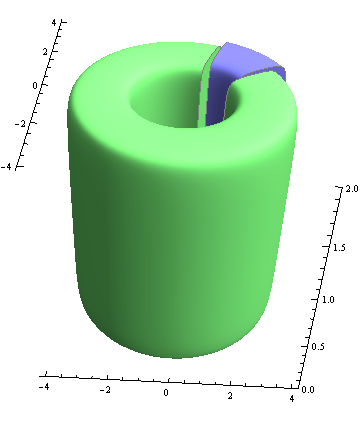
Update: Speaking of "pie slices", you can use SectorChart3D directly as follows:

ClearAll[sliceF]
sliceF[opts : OptionsPattern[]][x_, y_, r_: {0, 2}, h_: 2] := 
 SectorChart3D[{{(y - x) Degree, r[[2]], h}, {(360 - y + x) Degree , 
    r[[2]], h}}, SectorOrigin -> {{x Degree}, r[[1]]}, opts]

sliceF[BoxRatios -> 1, Axes -> True][30, 70]
Mathematica graphics

sliceF[BoxRatios -> 1, Axes -> True][30, 70, {1, 2}]
Mathematica graphics

sliceF[BoxRatios -> 1, Axes -> True,  ChartElementFunction -> 
  ChartElementDataFunction["ProfileSector3D", "Profile" -> 5]][30, 70, {3/2, 2}]
Mathematica graphics

Original post:

ClearAll[csF]
csF[opts : OptionsPattern[]][angle_: {0, Pi/2}, radii_: {0, 1}, 
  minmaxheight_: {0, 1}, style_: {EdgeForm[], Opacity[1], Orange}] := 
 Graphics3D[{## & @@ style, 
   ChartElementData["CylindricalSector3D"][{angle, radii, minmaxheight}, 0]}, opts]

csF[][{0, 3 Pi/4}]
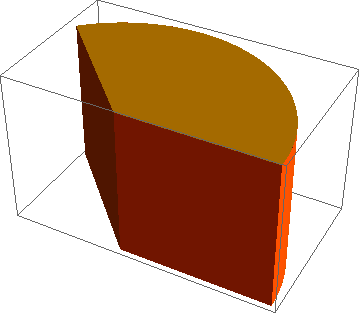
Mathematica graphics

csF[Boxed -> False, ImageSize -> 400][{0, 3 Pi/4}, {.5, 1}]
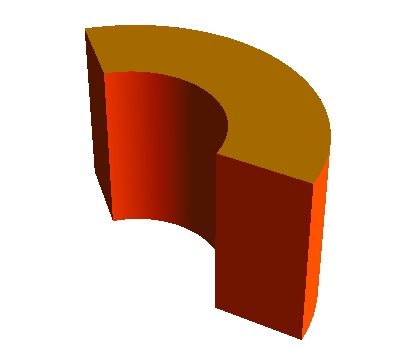
Mathematica graphics

Panel@Row[csF[ Boxed -> False, ImageSize -> 200][{0, #}, {0, 1}, {0, 1}, 
  {EdgeForm[]}] & /@ (Pi {1/3,  3/2, 4/3})]
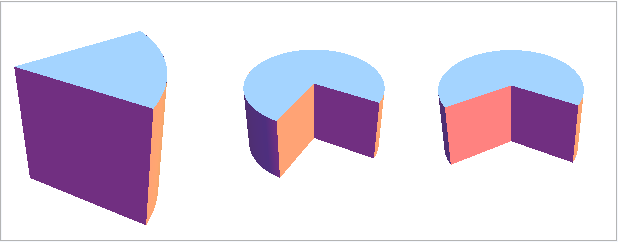
Mathematica graphics

Panel@Row[csF[ Boxed -> False, ImageSize -> 200][{0, Pi/4}, {#, 1}, {0, 1},
   {EdgeForm[]}] & /@ ({0, 1/3, 2/3})]
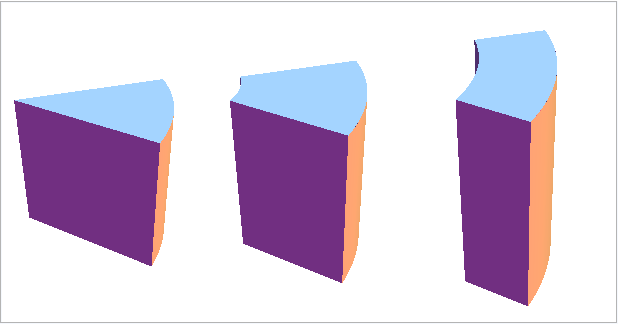
Mathematica graphics

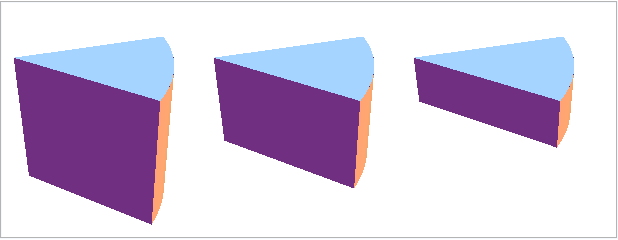
Panel@Row[csF[ Boxed -> False, ImageSize -> 200, PlotRange -> {0, 1}][{0, 
      Pi/4}, {0, 1}, {#, 1}, {EdgeForm[]}] & /@ ({0, 1/3, 2/3})]
Mathematica graphics

$\endgroup$
1
  • $\begingroup$ +1,I always learn something...ChartElementData opens up a lot of potential value :) $\endgroup$
    – ubpdqn
    Commented Apr 17, 2016 at 11:27
5
$\begingroup$

See if the following can give you a starting point:

radius = 3; height = 3; angle = 30 Degree;

RegionPlot3D[
  x^2 + y^2 <= radius^2 && x >= 0 && 0 <= y <= ArcTan[angle] x && 0 <= z <= height,
  {x, 0, 4}, {y, 0, 4}, {z, 0, height},
  Mesh -> None, PlotPoints -> 100, 
  PlotRangePadding -> {Scaled[0.05], Scaled[0.05], Scaled[.1]},
  Boxed -> False, Axes -> False
]

Mathematica graphics

$\endgroup$

Your Answer

By clicking “Post Your Answer”, you agree to our terms of service and acknowledge you have read our privacy policy.

Not the answer you're looking for? Browse other questions tagged or ask your own question.