The documentation for ListSliceDensityPlot3D says
ListSliceDensityPlot3D[{{x1,y1,z1,f1},{x2,y2,z2,f2},…},surf]generates a slice density plot for the values $f_i$ at points $\{x_i,y_i,z_i\}$.
But what if my surface is defined only numerically?
list1 = Table[{x, y, z, x^2 + y^2 - z^2}, {x, -1, 1, .05}, {y, -1,
     1, .05}, {z, -1, 1, .05}]~Flatten~2;
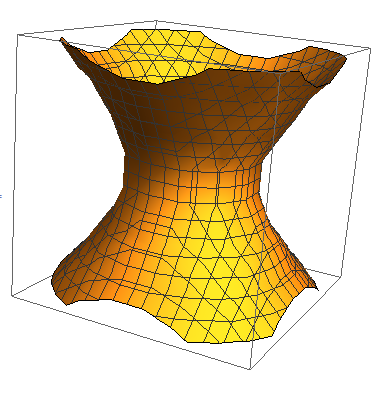
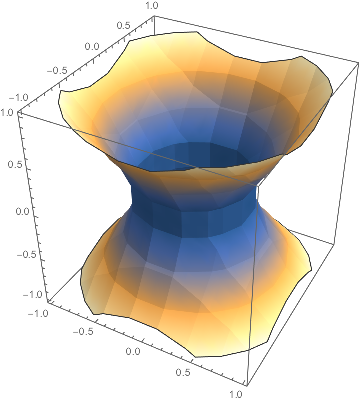
surface1 = First @ ListContourPlot3D[list1, Contours -> {0.3}];
Graphics3D @ surface1
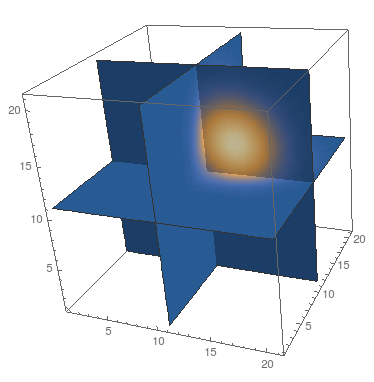
This seems clearly to be a surface, so let's try to use it in ListSliceDensityPlot3D:
ListSliceDensityPlot3D[
 Table[Exp[-3^2 ((x - .3)^2 + (y - .3)^2 + (z - .3)^2)],
  {x, -1, 1, .1}, {y, -1, 1, .1}, {z, -1, 1, .1}],
 surface1]
I get the error
ListSliceDensityPlot3D::slice: "Slice specification
GraphicsComplex[<<1>>]should be a named slice, surface or volume region, or list of slices."
and it uses the default slices
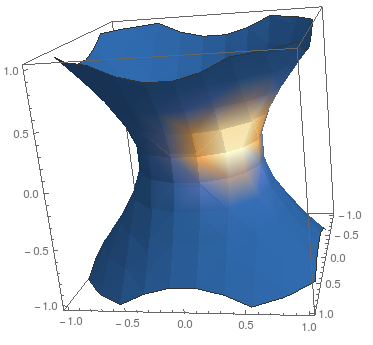
Of course in this example I could use ImplicitRegion[x^2 + y^2 - z^2==0.3,{x,y,z}] to define the surface,
ListSliceDensityPlot3D[
 Table[Exp[-3^2 ((x - .3)^2 + (y - .3)^2 + (z - .3)^2)],
  {x, -1, 1, .1}, {y, -1, 1, .1}, {z, -1, 1, .1}],
 ImplicitRegion[x^2 + y^2 - z^2 == 0.3, {x, y, z}],
 DataRange -> {{-1, 1}, {-1, 1}, {-1, 1}}]
but what if I don't have the equation, but only the data? If I try to define the ImplicitRegion using an interpolation function it does not work.
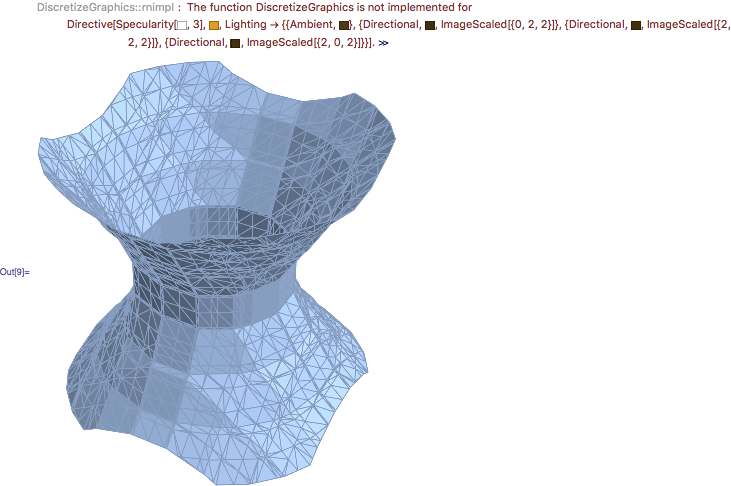
I can't apply DiscretizeRegion to the contour plot, what can I do to extract the surface?

ListSliceDensityPlot3D. When I definesurf = First@ListContourPlot3D[list1, Contours -> {0.3}]and then try to use it viaListSliceDensityPlot3D[list2, surf]I get the error "Slice specification GraphicsComplex[<<1>>] should be a named slice, surface or volume region, or list of slices." $\endgroup$ListSliceDensityPlot3Dand I just want to try and do so. $\endgroup$