2
$\begingroup$

How can I use Mathematica to plot the region $$\left\{\big(\cos(x+y),\cos(x-y)\big)\left\lvert(x,y)\in\left(0,\frac\pi2\right)^2\right.\right\}~?$$

I thought of using RegionPlot and "$\arccos$"s, but this wouldn't work if I were to plot the region $$\left\{\big(\cos\left(x^2+\sin y\right),\cos\left(\mathrm e^x-y\right)\big)\left\lvert(x,y)\in\left(0,\frac\pi2\right)^2\right.\right\}.$$ Another way might be to use two great loop with small increment of $x$, $y$, but that's not efficient.

$\endgroup$

2 Answers 2

4
$\begingroup$

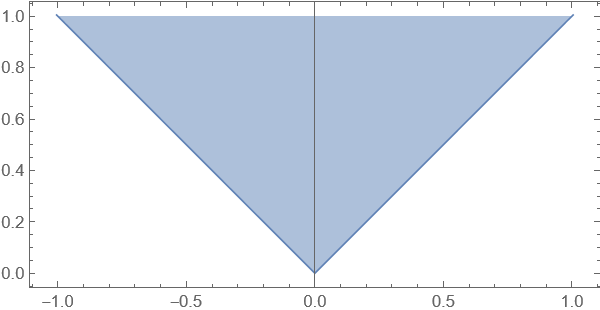
ParametricPlot` can plot region:

ParametricPlot[{Cos[x + y], Cos[x - y]}, {x, 0, Pi/2}, {y, 0, Pi/2}]

enter image description here

$\endgroup$
2
  • $\begingroup$ Thanks. It worked. $\endgroup$
    – youthdoo
    Commented Feb 7 at 6:44
  • $\begingroup$ @youthdoo glad was helpful. Enjoy time with Wolfram Language/Mathematica. :) $\endgroup$
    – ubpdqn
    Commented Feb 7 at 6:57
2
$\begingroup$

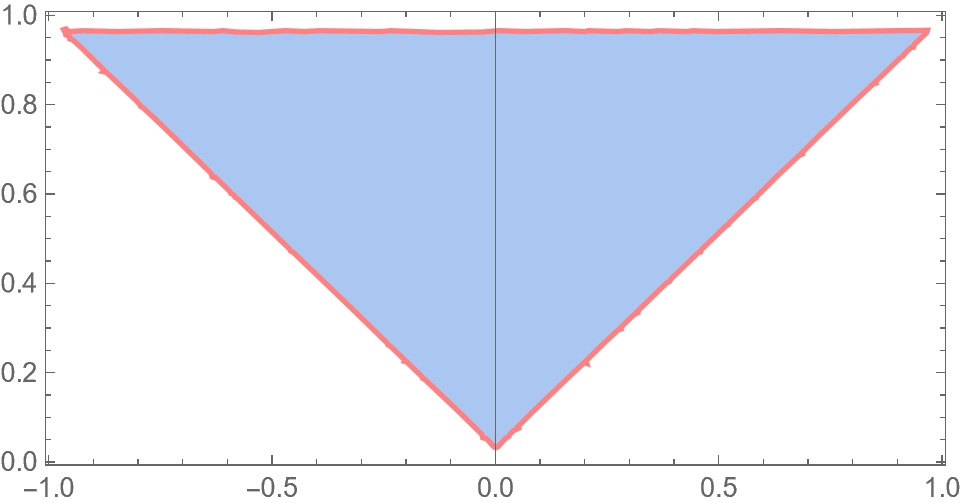
Or use ParametricRegion + Region. (or RegionPlot)

reg = ParametricRegion[{Cos[x + y], 
    Cos[x - y]}, {{x, 0, Pi/2}, {y, 0, Pi/2}}];
Region[reg, BaseStyle -> {EdgeForm[Directive@{Thick, Pink}]}, 
 Axes -> True, Frame -> True]
reg//Area

enter image description here

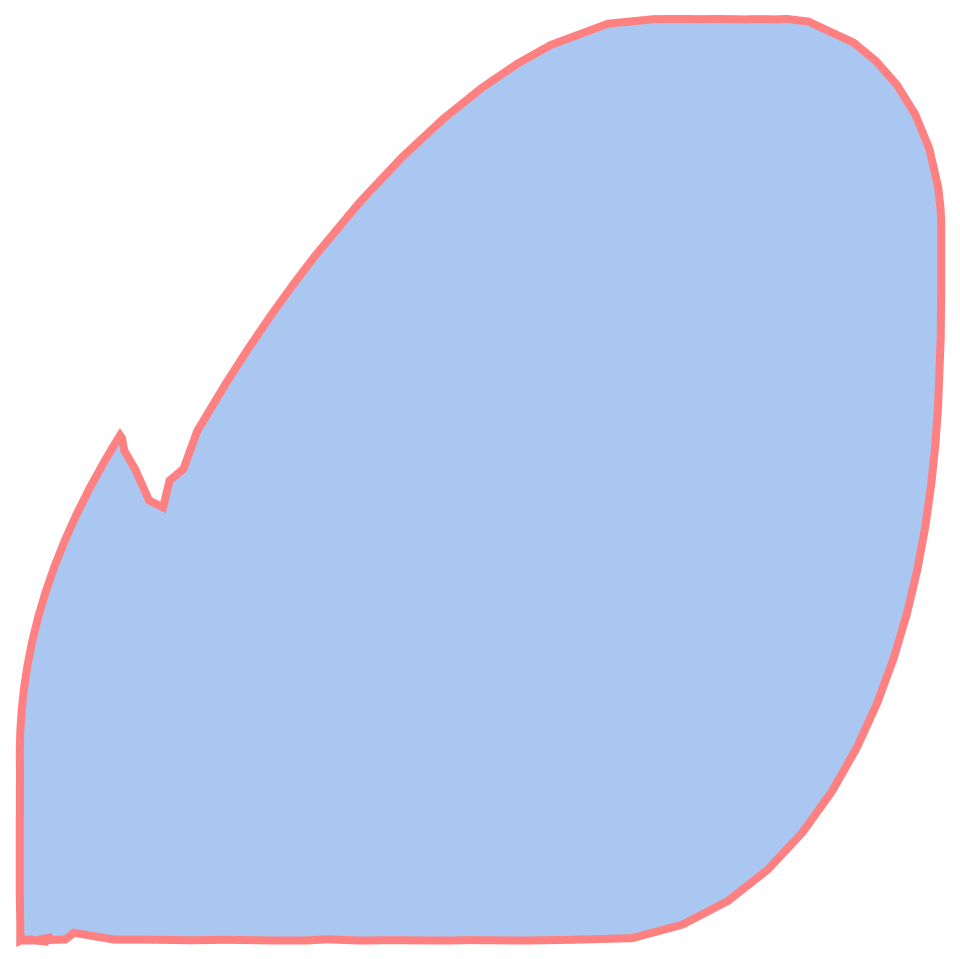
1.

Clear[reg];
reg = ParametricRegion[{Cos[x^2 + Sin@y], 
    Cos[E^x - y]}, {{x, 0, Pi/2}, {y, 0, Pi/2}}];
Region[reg, 
 BaseStyle -> {EdgeForm[Directive@{AbsoluteThickness[3], Pink}]}]

enter image description here

$\endgroup$
2
  • $\begingroup$ Thanks too. I wonder why the edges seem to be a bit rough... $\endgroup$
    – youthdoo
    Commented Feb 7 at 10:09
  • $\begingroup$ @youthdoo RegionPlot automatic discrete the region, it is not easy to get the exact boundary. $\endgroup$
    – GMT
    Commented Feb 7 at 11:36

Your Answer

By clicking “Post Your Answer”, you agree to our terms of service and acknowledge you have read our privacy policy.

Not the answer you're looking for? Browse other questions tagged or ask your own question.