12
$\begingroup$

I tried these

ContourPlot[ 1 + (1 + x)^3 - 3 (1 + x) y + y^3 == 0, {x, -3, 3}, {y, -3, 3}]
ContourPlot[(x + y + 2) == 0, {x, -3, 3}, {y, -3, 3}]
ContourPlot[(x + y + 2)^2 == 0, {x, -3, 3}, {y, -3, 3}]
ContourPlot[(x + y + 2)^3 == 0, {x, -3, 3}, {y, -3, 3}]

the third and fourth one produce graphs contrary to my mathematical common sense. Especially, the third one does not produce anything.

Could someone explain why and how to fix it?

$\endgroup$
1

4 Answers 4

14
$\begingroup$

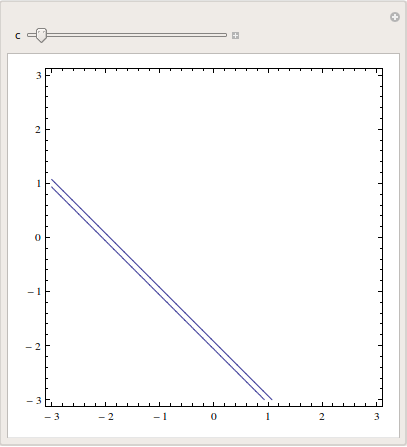
Plotting contours is sometimes an art, but your third example has a reason why it doesn't work: ContourPlot cannot find contours that only touch the values and not cross it. Your zero contour is not crossed but only touched.

You can quickly check that contours corresponding to heights greater than zero for this example are found because they are crossed:

Manipulate[
 ContourPlot[(x + y + 2)^2 == c, {x, -3, 3}, {y, -3, 3}],
 {{c, .1}, 0, .1}
 ]

contour plot manipulate

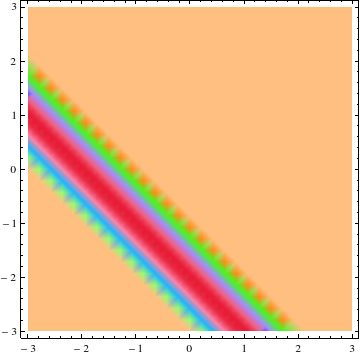
One possible solution is to first use DensityPlot, because this simply rasterizes the plane and, with an adapted ColorFunction, you can guess where the zero should be and then try to find the mistake in ContourPlot:

DensityPlot[(x + y + 2)^2, {x, -3, 3}, {y, -3, 3}, 
 ColorFunctionScaling -> False, ColorFunction -> "BrightBands"]

density plot

$\endgroup$
4
  • $\begingroup$ Thank you for the answer. I figured that I might get the solution first and plot. But to my dismay, it didn't work. ContourPlot[{y - 2 - x == 0} , {x, -4, 4}, {y, -4, 4}] works, but b = {y - 2 - x == 0}; ContourPlot[b , {x, -4, 4}, {y, -4, 4}] doesn't. And b = {y - 2 - x == 0}; ContourPlot[b//Evaluate , {x, -4, 4}, {y, -4, 4}] works!!! $\endgroup$
    – user6932
    Commented Apr 16, 2013 at 0:48
  • 1
    $\begingroup$ @user6932 It's because ContourPlot has attribute HoldAll and does not evaluate the b to the expression. Using Evaluate is the right way. $\endgroup$
    – halirutan
    Commented Apr 16, 2013 at 0:53
  • $\begingroup$ And lastly, {a} = Solve[(x + y + 2)^2 == 0, {x, y}]; ContourPlot[a // Evaluate, {x, -4, 4}, {y, -4, 4}] doesn't work!!! $\endgroup$
    – user6932
    Commented Apr 16, 2013 at 0:54
  • $\begingroup$ Solve gives a Rule, not an equation! Try {a} = First@Solve[(x + y + 2)^2 == 0, {x, y}] and ContourPlot[Evaluate[Equal @@ a], {x, -4, 4}, {y, -4, 4}] $\endgroup$
    – halirutan
    Commented Apr 16, 2013 at 0:57
5
$\begingroup$

ContourPlot seems to be based on the Intermediate Value Theorem. It finds points greater or less than the contour level, or in your case, where the value of the left hand side is greater and where it is less than the right hand side -- unless it is lucky enough to find points where the equation is satisfied exactly. In your third example (x + y + 2)^2 == 0, the left hand side is positive except along the line.

Sometimes you can get around this by putting in extra points:

ContourPlot[(x + y + 2)^2 == 0, {x, -3, 3}, {y, -3, 3}, 
 PlotPoints -> {Automatic, Table[{x, -2 - x}, {x, -3, 3, 0.01}]}]

ContourPlot of line

But it presupposes that you more or less know how to plot the contour. So why use ContourPlot? The trick doesn't work so well for curves either.

Edit

Now if the function factors and you're only looking for the zero set, you can try the following.

g = x y^6 + y^7 + 2 x y^3 Sin[x] + 2 y^4 Sin[x] + x Sin[x]^2 + y Sin[x]^2;
ContourPlot[Evaluate[Times @@ First /@ Rest@FactorList[g] == 0], {x, -3, 3}, {y, -3, 3}]

Contour plot of g

It's somewhat nicer, if you don't mind the factors getting different colors, like this:

ContourPlot[Evaluate[First[#] == 0 & /@ Rest@FactorList[g]], {x, -3, 3}, {y, -3, 3}]
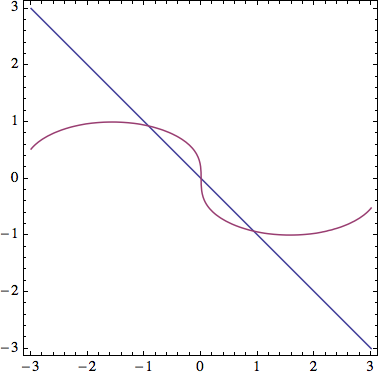
Contours of g with factors individually colored

$\endgroup$
2
  • 2
    $\begingroup$ +1. Thank you for showing the undocumented form of PlotPoints specification! It may help also with this question. $\endgroup$ Commented Apr 16, 2013 at 8:34
  • 3
    $\begingroup$ @AlexeyPopkov You might be interested in this question. This option is really only useful if you know where to place the points beforehand, and for ContourPlot to connect the contour, it helps a lot for there to be connected regions on either side of the contour in which the functions takes on values on either side of the contour level. $\endgroup$
    – Michael E2
    Commented Apr 16, 2013 at 11:53
3
$\begingroup$

I do not agree with the "never crossing" thesis. It is a matter of equally spaced vertical bins. See the full explanation here. A logarithmic scale for the 3rd example of the OP is implemented by the following code:

ContourPlot[Log[Abs[(x + y + 2)^2]], {x, -3, 3}, {y, -3, 3}, 
 ImageSize -> 400, PlotPoints -> 80, PlotLegends -> Automatic, 
 ColorFunction -> "DarkRainbow", ClippingStyle -> Black, 
 Contours -> 80]

enter image description here

In this case, the graph never crosses -∞, but the spacing of the vertical bins is more appropriate for ContourPlot.

Incidentally, the OP's first example produces a graph that misses a solution:

ContourPlot[ 1 + (1 + x)^3 - 3 (1 + x) y + y^3 == 0, {x, -3, 3}, {y, -3, 3}]

enter image description here

The point $x=0$, $y=1$ should appear:

ContourPlot[ Log[Abs[1 + (1 + x)^3 - 3 (1 + x) y + y^3]], {x, -3, 3}, {y, -3, 3}, 
 ImageSize -> 400, PlotPoints -> 80, PlotLegends -> Automatic, 
 ColorFunction -> "DarkRainbow", ClippingStyle -> Black, 
 Contours -> 80]

enter image description here

$\endgroup$
2
$\begingroup$

Now that halirutan has pointed out correctly why ContourPlot fails in your third example, we can look at alternate ways to plot it. One straightforward way is to explicitly solve for the contour and plot it:

With[{sol = x /. First@Union@Solve[(x + y + 2)^2 == 0, x]},
    Plot[sol, {y, -3, 3}, PlotRange -> {-3, 3}, Frame -> True, AspectRatio -> 1, Axes -> False]]

enter image description here

The drawback with this is that if you have equations for which the contours are periodic, then you will have to handle repetitions appropriately. Also, sometimes Solve and Reduce fail to return satisfactory solutions (at least, not without extensive cajoling), whereas ContourPlot would have no trouble plotting the contour. There certainly are ways around this, but definitely not something as simple as for this case. Nevertheless, it's an approach worth knowing and trying out.

$\endgroup$

Your Answer

By clicking “Post Your Answer”, you agree to our terms of service and acknowledge you have read our privacy policy.

Not the answer you're looking for? Browse other questions tagged or ask your own question.