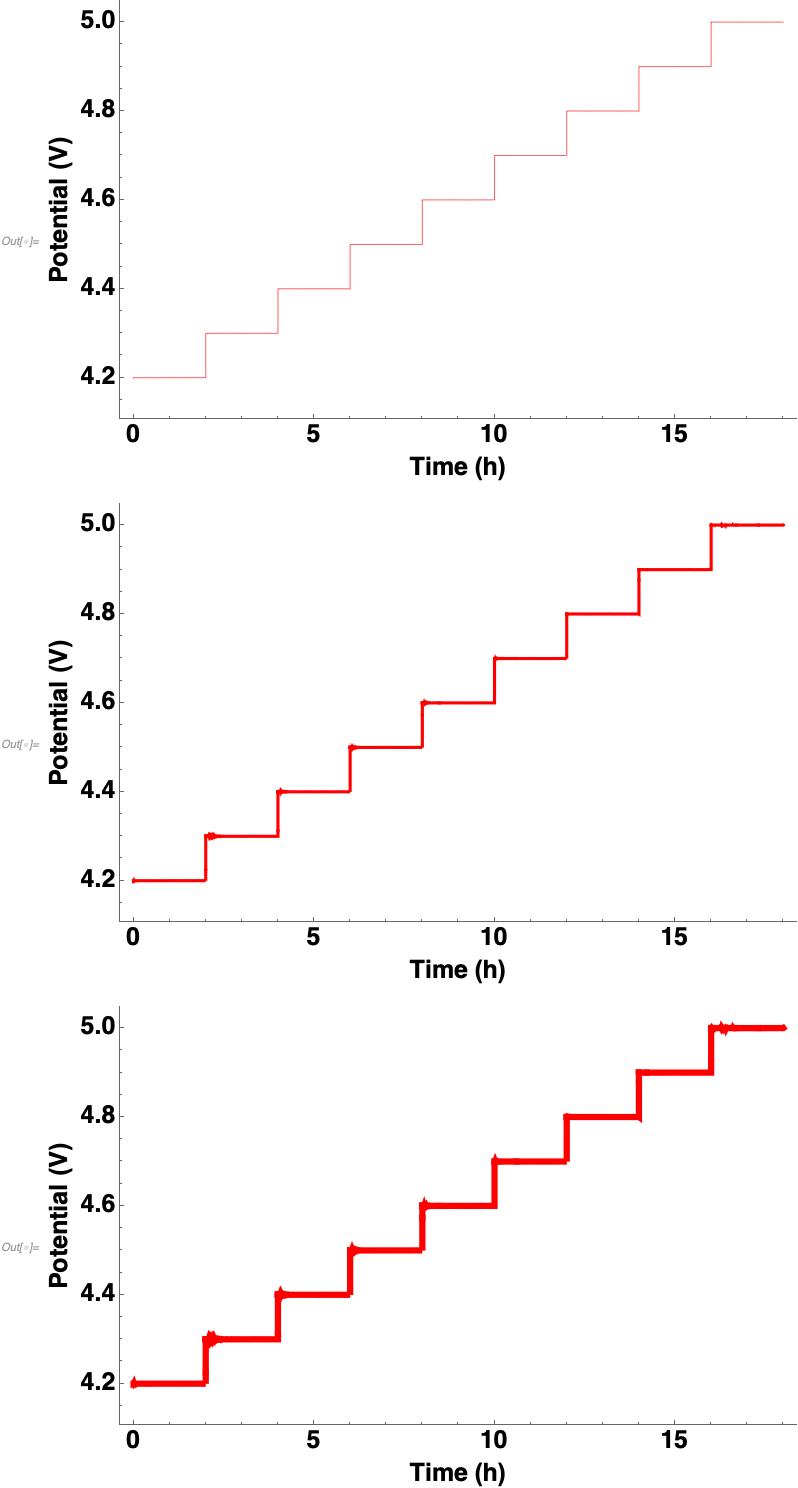
I'm plotting a list of data (v) where some of the points are very close together. No problem if AbsoluteThickness[x] is set to x=0.5, but the trace begins to look fuzzy if x>2.5. This is mainly an issue at the beginning of each stair step, where there are a ton of data points. Is there anything I can do to fix this?
Voltage[x_] :=
 ListLinePlot[
  v,
  PlotStyle -> {Red, AbsoluteThickness[x]},
  PlotRange -> Automatic,
  ImageSize -> 600,
  LabelStyle -> {FontSize -> 20, FontFamily -> "Helvetica", Black,
    Bold},
  Frame -> {True, True, False, False},
  FrameLabel -> {{"Potential (V)", ""}, {"Time (h)", "" }}
  ]

Voltage[0.5]
Voltage[2.5]
Voltage[5]
And no, I cannot weed out data points so my graph looks better.
Thanks for taking the time to read this.


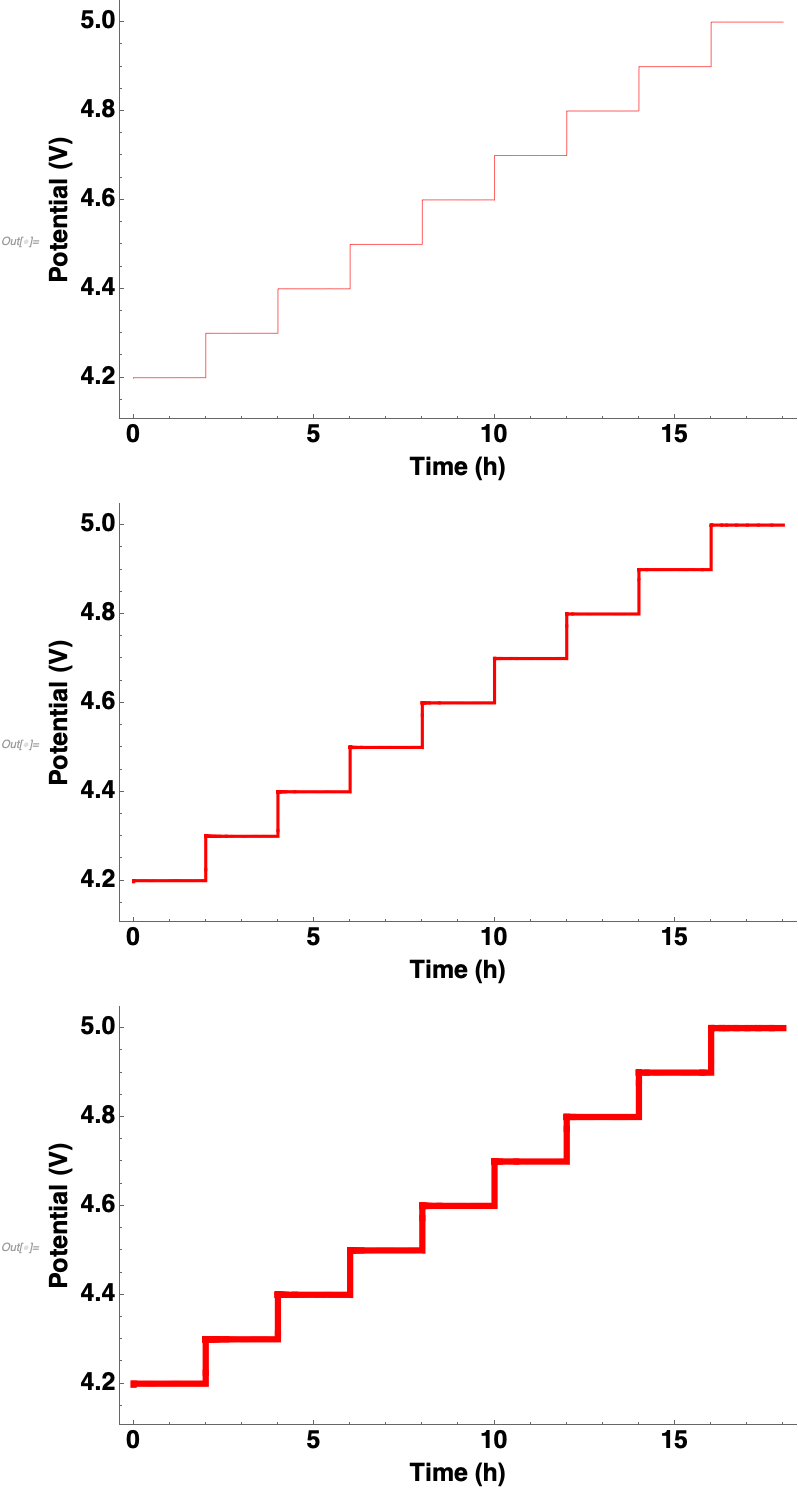
InterpolationOrder -> 0as an option toPlotcleans it up a bit. Is that good enough? $\endgroup$