5
$\begingroup$

Solving the following PDE, defined in the same domain of a previous question:

p = 0.2;
Pe = 20;
<< NDSolve`FEM`
boundaries = {-r + 
    1/2 (Sqrt[2] Sqrt[Cos[2 \[Theta]] (1 - p)^2 + 2 p + 1 - p^2] + 
       2 Cos[\[Theta]] (1 - p)), 
   r - 8, -\[Theta] + Pi/2, \[Theta] - Pi, -\[Phi], \[Phi] - Pi};
\[CapitalOmega] = 
  ToElementMesh[
   ImplicitRegion[
    And @@ (# <= 0 & /@ boundaries), {r, \[Theta], \[Phi]}], 
   "MaxBoundaryCellMeasure" -> 0.04];
Show[\[CapitalOmega][
  "Wireframe"["MeshElement" -> "MeshElements", Boxed -> True]], 
 AxesLabel -> {"r", "\[Theta]", "\[Phi]"}, 
 PlotRange -> {{0.15, 1}, {1.5, 3.16}, {0, 3.16}}]

and

sol = NDSolveValue[{Sin[\[Theta]] Cos[\[Phi]] D[
       T[r, \[Theta], \[Phi]], r] + (Cos[\[Theta]] Cos[\[Phi]])/
      r D[T[r, \[Theta], \[Phi]], \[Theta]] - 
     1/r D[T[r, \[Theta], \[Phi]], \[Phi]] == 
    1/Pe (1/r^2 D[r^2 D[T[r, \[Theta], \[Phi]], r], r] + 
       1/(r^2 Sin[\[Theta]])
         D[Sin[\[Theta]] D[
           T[r, \[Theta], \[Phi]], \[Theta]], \[Theta]] + 
       1/(r^2 (Sin[\[Theta]])^2)
         D[T[r, \[Theta], \[Phi]], {\[Phi], 2}]), {DirichletCondition[
     T[r, \[Theta], \[Phi]] == 1., boundaries[[1]] == 0.],
    DirichletCondition[T[r, \[Theta], \[Phi]] == 0., 
     boundaries[[2]] == 0.]}}, 
  T, {r, \[Theta], \[Phi]} \[Element] \[CapitalOmega]]

I noticed a strange behavior of the solution. For example:

\[Theta]1 = 0.6 Pi;
sol[1/2 (Sqrt[2] Sqrt[Cos[2 \[Theta]1] (1 - p)^2 + 2 p + 1 - p^2] + 
    2 Cos[\[Theta]1] (1 - p)), \[Theta]1, 0 Pi]

or

sol[0.5, 0.5 Pi, 0 Pi]

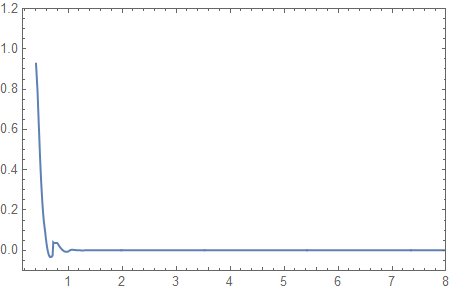
give: InterpolatingFunction::dmval: Input value {.....} lies outside the range of data in the interpolating function. Extrapolation will be used, though the input values are inside the domain of the solution. Furthermore, the plot of the solution for small values of \[Phi]] looks fine:

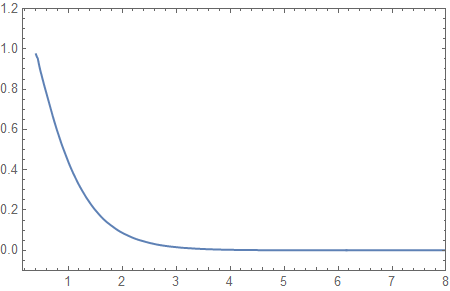
Plot[sol[r, 0.6 Pi, 0.0 Pi], {r, 0.4025, 8}, Frame -> True, 
 PlotRange -> {{0.15, 8}, {-0.1, 1.2}}]

fig1

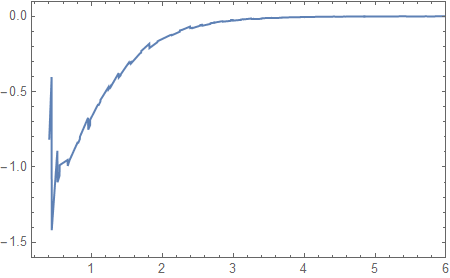
but

Plot[sol[r, 0.6 Pi, 0.8 Pi], {r, 0.4025, 8}, Frame -> True, 
 PlotRange -> {{0.15, 8}, {-0.1, 1.2}}]

gives:

fig2

Things are even worse with the derivative of the solution, that I need to find the gradient of T on the curved portion of the domain, the final aim being to calculate the flow of the grad of T through the spherical cap. E.g.,

Dr[r_, \[Theta]_, \[Phi]_] = D[sol[r, \[Theta], \[Phi]], r]
Plot[Dr[r, 0.6 Pi, 0.0 Pi], {r, 0.403, 8}, Frame -> True, 
 PlotRange -> {{0.15, 6}, {-1.6, 0.1}}]

gives:

fig3

Things seem to improve if the MaxBoundaryCellMeasure is decreased, at the cost of the computational time however, but the problems on the derivative still remain. I am grateful for any help.

$\endgroup$
8
  • 1
    $\begingroup$ It looks like you try to solve PDE in the spherical segment using spherical coordinates. Do you realize that this PDE has singular coefficients on some borders? $\endgroup$ Commented May 25, 2021 at 12:01
  • $\begingroup$ You are right, it is probably better to switch to Cartesian coordinates? $\endgroup$
    – umby
    Commented May 25, 2021 at 13:04
  • 1
    $\begingroup$ Generally, I would say that unless you can take advantage of symmetry to reduce the dimension of the problem (e.g., axisymmetry), it is best to use Cartesian coordinates. $\endgroup$
    – Tim Laska
    Commented May 25, 2021 at 14:41
  • $\begingroup$ Following your advice, I edit the question changing the coordinate system of the problem. Thank you for your help, Tim Laska and Alex Trounev. $\endgroup$
    – umby
    Commented May 26, 2021 at 14:55
  • 1
    $\begingroup$ There's a Rollback botton in mathematica.stackexchange.com/posts/246611/revisions :) $\endgroup$
    – xzczd
    Commented May 28, 2021 at 8:44

1 Answer 1

6
$\begingroup$

Your post contains three different questions.

The first is why you get the warning "Input value {.....} lies outside the range of data in the interpolating function?"

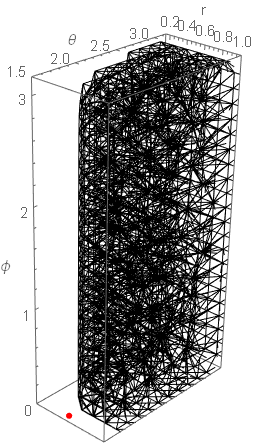
The answer is that this point, indeed, lies outside the mesh. One can make this sure by plotting the mesh simultaneously with the point in question:

Show[{
  \[CapitalOmega][
   "Wireframe"["MeshElement" -> "MeshElements", Boxed -> True]],
  Graphics3D[{Red, PointSize[0.03], Point[{0.5, 0.5 Pi, 0 Pi}]}]
  }, Axes -> True, AxesLabel -> {"r", "\[Theta]", "\[Phi]"}, 
 PlotRange -> {{0.15, 1}, {1.5, 3.16}, {0, 3.16}}]

yielding the following image:

enter image description here

Here the red dot indicates the point {0.5, 0.5 Pi, 0 Pi}. One can see that it is outside the mesh built in the previous code.

Later edit: Also the point

{1/2 (Sqrt[2] Sqrt[Cos[2 \[Theta]1] (1 - p)^2 + 2 p + 1 - p^2] + 
     2 Cos[\[Theta]1] (1 - p)), \[Theta]1, 0.0 Pi} /. \[Theta]1 ->0.6 Pi

(*  {0.40172, 1.88496, 0.}  *)

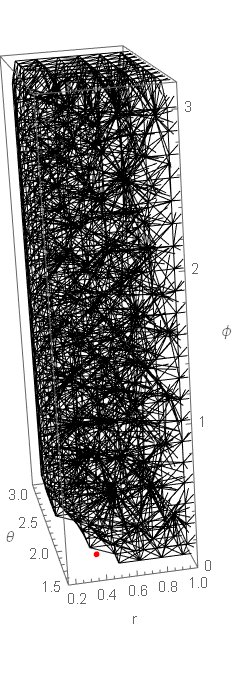
lies outside the mesh. To make it clear one needs again draw the mesh together with this point:

Show[{\[CapitalOmega][
   "Wireframe"["MeshElement" -> "MeshElements", Boxed -> True]],
  
  Graphics3D[{Red, PointSize[0.03], 
    Point[{1/
         2 (Sqrt[2] Sqrt[
            Cos[2 \[Theta]1] (1 - p)^2 + 2 p + 1 - p^2] + 
          2 Cos[\[Theta]1] (1 - p)), \[Theta]1, 
       0.0 Pi}] /. \[Theta]1 -> 0.6 Pi}]},
 
 Axes -> True, AxesLabel -> {"r", "\[Theta]", "\[Phi]"}, 
 PlotRange -> {{0.15, 1}, {1.5, 3.16}, {0, 3.16}}]

and then turn the whole image against the clock. The image is shown below:

enter image description here

One can see that this point also lies outside the mesh. It only seemed covered by the mesh in the case of the default ViewPoint.

Continuation:

The second question is what's wrong with your second plot.

Indeed, it looks incorrectly. When I evaluated your code I got the message:

"The computed Peclet number is 3.568... and is larger than the mesh order (2), and the result may not be stable. Refining the mesh or adding artificial diffusion may help."

In other words, the first attempt I would do in such a case would be mesh refinement. Other steps proposed by the message I would only undertake if this first attempt will not help.

The third question is why the last plot looks so noisy. The reason, I think, is that here the derivative of the interpolation function is calculated numerically. Such a behavior is typical for the numeric derivatives and always takes place if after the numerical solution of a differential equation one looks for its derivative.

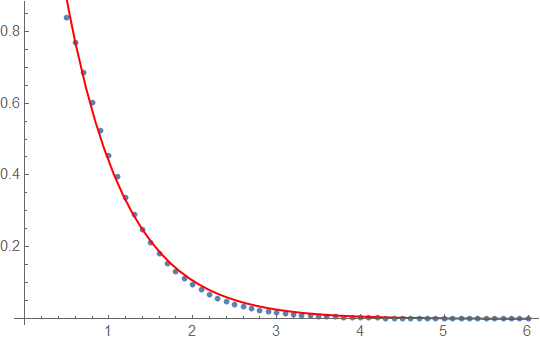
I think there could be several workarounds. In such a case, I would do here as follows. Using the solution I would create a list along the direction you need to get the gradient and then fit it by some analytic function. In the case under the study it can be as follows:

lst = Table[{r, sol[r, 0.6 Pi, 0.0 Pi]}, {r, 0.5, 6, 0.1}];
model = a*Exp[-b*r];
ff = FindFit[lst, model, {a, b}, r]

(*  {a -> 1.79379, b -> 1.41339}  *)

Let us visually check the fitting quality:

Show[{
  ListPlot[lst],
  Plot[model /. ff, {r, 0.5, 6}, PlotStyle -> Red, PlotRange -> All]
  }]

with the following effect

enter image description here

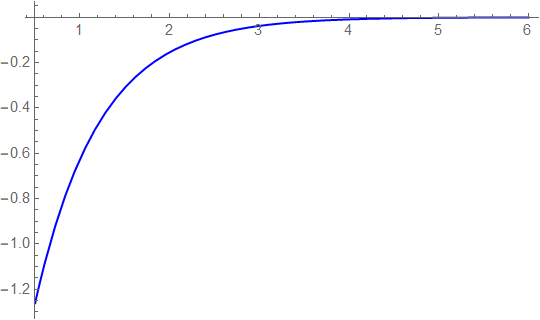
If you are satisfied with the quality (I would be reasonably satisfied) you can find the derivative

D[model /. ff, r]

(*  -2.53532 E^(-1.41339 r)  *)

and plot it:

Plot[-2.54 E^(-1.4 r), {r, 0.5, 6}, PlotStyle -> Blue,PlotRange -> All]

enter image description here

which I hope looks as expected.

Maybe, there are also other, better workarounds.

Have fun!

$\endgroup$
5
  • $\begingroup$ You are right about {0.5, 0.5 Pi, 0 Pi}, but the point {1/2 (Sqrt[2] Sqrt[Cos[2 \[Theta]1] (1 - p)^2 + 2 p + 1 - p^2] + 2 Cos[\[Theta]1] (1 - p)), \[Theta]1, 0.0 Pi} for \[Theta]1 = 0.6 Pi is surely on the boundary and calculating the solution sol in this point gives the same: InterpolatingFunction::dmval: Input value {...} lies outside the range of data in the Interpolating function. Extrapolation will be used. The output is Indeterminate. As you suggested, it is probably a matter of mesh fineness? $\endgroup$
    – umby
    Commented May 25, 2021 at 13:18
  • $\begingroup$ Please see the edit. May it happen that the boundary mesh you used is too rough and some of the points you need do not get onto it? $\endgroup$ Commented May 25, 2021 at 13:48
  • $\begingroup$ Many thanks; it just like that, there is the need to reduce the mesh size but just near the curved boundary (i.e. where r==1/2 (Sqrt[2] Sqrt[Cos[2 \[Theta]] (1 - p)^2 + 2 p + 1 - p^2] + 2 Cos[\[Theta]] (1 - p))), otherwise the computational time explodes; or maybe using curved elements for the mesh. Using MaxBoundaryCellMeasure does not work, because it reduces the mesh near all the boundaries even where there is no need of a reduction. $\endgroup$
    – umby
    Commented May 25, 2021 at 14:24
  • $\begingroup$ Your workaround about the derivative is fine, but in terms more generals, I am looking for the gradient of the solution: the derivative of sol with respect to $r$ as function of $\phi$ and $\theta$ calculated at r==1/2 (Sqrt[2] Sqrt[Cos[2 \[Theta]] (1 - p)^2 + 2 p + 1 - p^2] + 2 Cos[\[Theta]] (1 - p)) and the derivative of sol with respect to $\theta$ as function of $\phi$ and $\theta$ calculated at r==1/2 (Sqrt[2] Sqrt[Cos[2 \[Theta]] (1 - p)^2 + 2 p + 1 - p^2] + 2 Cos[\[Theta]] (1 - p)). $\endgroup$
    – umby
    Commented May 25, 2021 at 14:36
  • 1
    $\begingroup$ That's why I have written about other ways that, maybe, exist. First, you have a problem with a complex domain. In this case, I would not expect that you can find a way to have a small computation time. You can improve the derivative by using a finer mesh. Maybe, it can be improved by using the more sophisticated numerical algorithms for the derivative. I know that they exist in Mma, but I am not familiar with them. In some cases, one succeeds to write the system of equations directly for the components of the gradient and solve for them. Then you do not need to find the derivative. $\endgroup$ Commented May 25, 2021 at 15:15

Your Answer

By clicking “Post Your Answer”, you agree to our terms of service and acknowledge you have read our privacy policy.

Not the answer you're looking for? Browse other questions tagged or ask your own question.