 I have 2 sets of data imported from excel file, Let say
A = 20
21
22
...
30A
B= 0
1
2
3
...
10
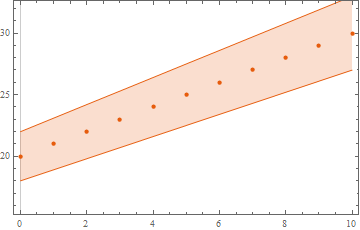
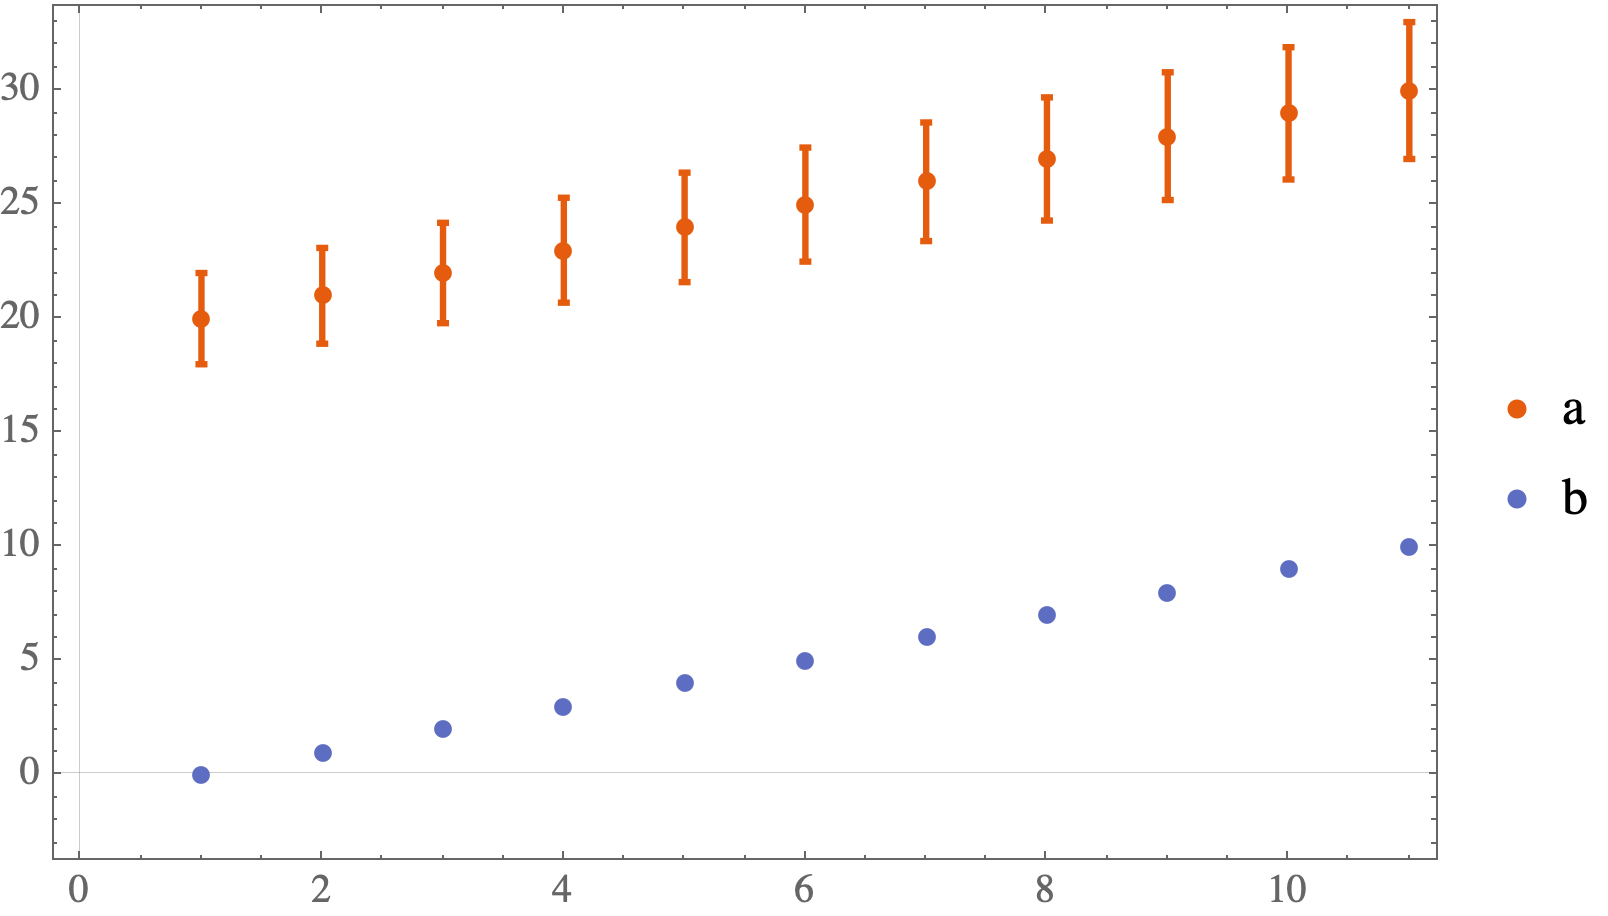
I want to plot A with a relative error of 10%
errordataA= Around[A,Scaled[.1]]
But output was "Around[A, Scaled[0.1]]" not "Around[2+-10%]".
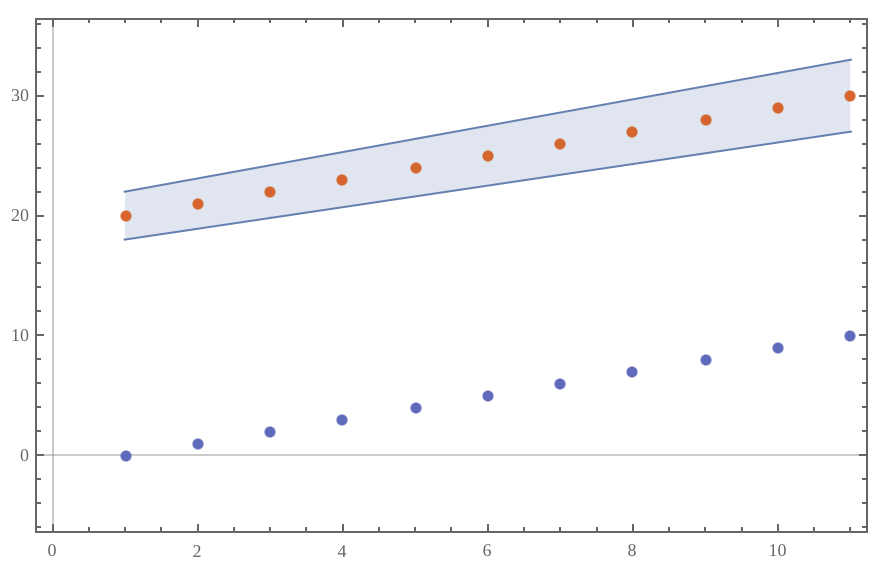
Then I want to create a plot with B.
ListPlot[
 {A,
  B
    }
   IntervalMarkers -> "Bands",
 Sequence[PlotTheme -> "Scientific",
  PlotRangePadding -> {Automatic, Scaled[0.15]}]
 ]
Since the code can't read set A data so the graph does not show. How can I fix this one?


Aroundis not defined as a function in your system (it is in blue in your screenshot). Note thatAroundwas introduced in version 12 (2019). What version are you using? $\endgroup$