0
$\begingroup$

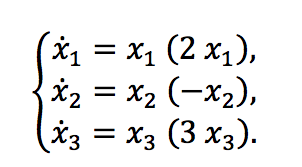
If I have three equations nonlinear. I need to see the behavior around (0,0). How do I plot the three-dimensional system? Thank you in advance.

enter image description here

I try to use this code

ParametricPlot3D[
 {2 x^2, -y^2, z^2}, 
 {u, 0, 2 Pi}, {v, 0, 2 Pi},
 PlotStyle -> {Red, Green}
 ]
$\endgroup$
1
  • 2
    $\begingroup$ If you solve these differential equations (e.g. DSolve[x'[t] == 2 x[t]^2, x, t]) you will get solutions with a constant in each of them. To find the constant, you must have some initial condition. Otherwise you can't plot the system. $\endgroup$
    – C. E.
    Commented Sep 27, 2020 at 7:54

1 Answer 1

4
$\begingroup$

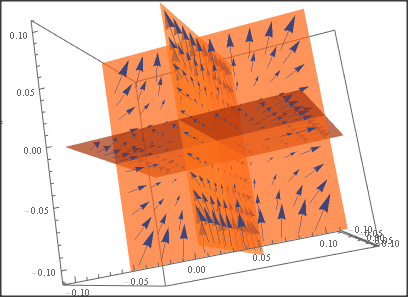
Your differential equation describes a vector field (velocity field) that you may display e.g. using SliceVectorPlot3D:

SliceVectorPlot3D[{2 x1^2, -2 x2^2, 
  3 x3^2}, "CenterPlanes", {x1, -.1, .1}, {x2, -.1, .1}, {x3, -.1, \
.1}, PlotTheme -> "Scientific"]

Velocity Field

You see, that e.g. a particle coming from below from {0.1,-0.1,-0.1} with velocity {0.02,-0.02,0.03} will turn into the direction {1,-1,0} and will never reach the x3==0` plane.

$\endgroup$
4
  • $\begingroup$ Shouldn't it be -1 x2^2? $\endgroup$
    – Lee
    Commented Sep 27, 2020 at 16:03
  • $\begingroup$ Thank you Daniel Huber, How do I make the shape move in place until I see the back parts $\endgroup$
    – user74531
    Commented Sep 27, 2020 at 17:07
  • $\begingroup$ @user74531 Simply click on the graphics and move the mouse. $\endgroup$ Commented Sep 28, 2020 at 8:19
  • $\begingroup$ @Lee Yews you are right, thank you. $\endgroup$ Commented Sep 28, 2020 at 8:21

Your Answer

By clicking “Post Your Answer”, you agree to our terms of service and acknowledge you have read our privacy policy.

Not the answer you're looking for? Browse other questions tagged or ask your own question.