I'm new to Mathematica and I am using it as a free trial online.
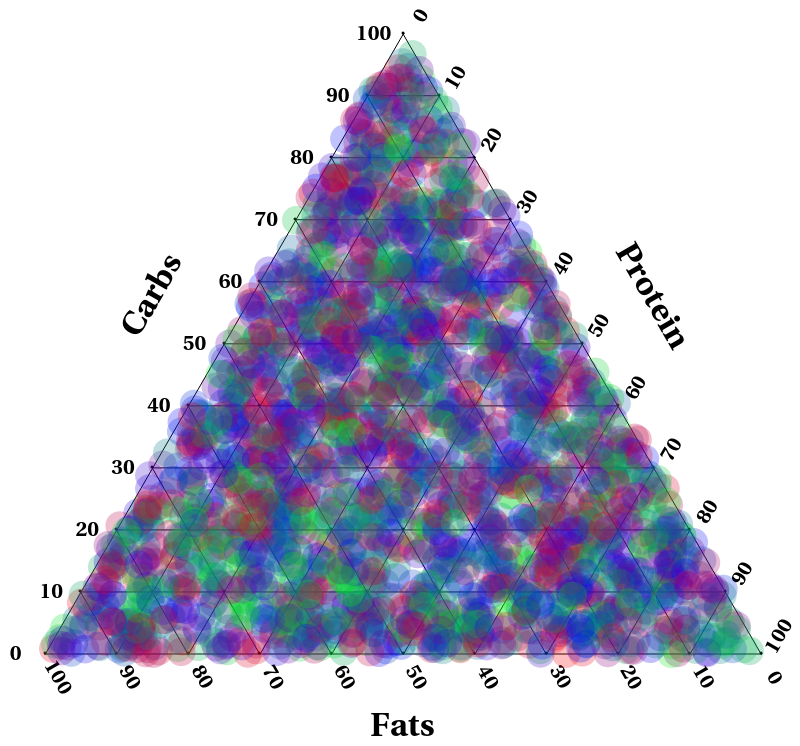
I am doing a biology experiment, varying the composition of people's diet and seeing the effect of that on sleep. Because I am varying macronutrient break down, I have a three part system. (eg. 50% protein, 30% carbohydrates, 20% fat etc). I can denote this percentage diet break down on a ternary plot.
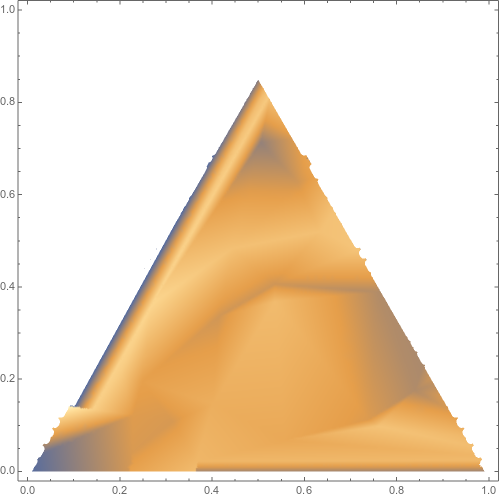
I then want to extend this into 3D space because my dependent variable is sleep duration etc - how can I plot this 'y' value for a corresponding point on the ternary plot?
eg. 7 hours sleep corresponds to 50:30:20, 8 hours sleep corresponds to 40:20:40 etc
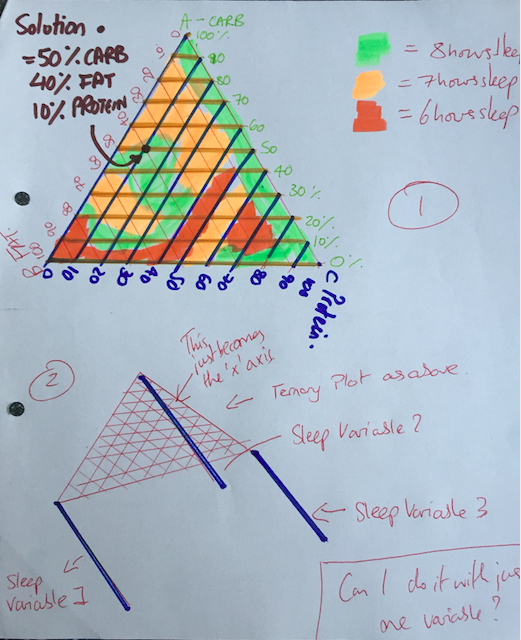
Appreciate I may not have been the clearest, so happy to explain things again if needs-be! In an attempt to make some thing clearer, I am attaching a hand drawn picture of what I think I want!
There are a couple of different ways I can visualise it in my head:
In the first idea - I have a density plot, with, for example, three different qualities of sleep.
In the second idea, the whole ternary plot becomes sort of an x axis? I then extend into the 3D plane with my sleep variable...this would be like a normal 'y' axis, i.e. the higher you go, the higher the number. Would it be possible to do this with just one sleep variable or would it have to be done with a minimum of two sleep variables? If it needs more than one sleep variable that is fine too, because I have for example, time it takes to get to sleep and deep sleep percentage too, which I could put on the same graph.
Hopefully my 'triangular prism' reference is starting to make sense now!!


