Here are some thoughts building on @MichaelE2's answer.
I'm visually oriented, so I converted your system into two first-order ODEs (with v[t]==x'[t]) to look at this in the phase-plane.
sol = NDSolve[{
  v'[t] == 1 - x[t] - 0.05 sgn[t] (1 + x[t]),
  x'[t] == v[t],
  x[0] == 0, v[0] == 1, sgn[0] == 1,
  WhenEvent[v[t] == 0, sgn[t] -> -sgn[t]]},
  {x, v, sgn}, {t, 0, 25}, DiscreteVariables -> {sgn[t]}][[1]];
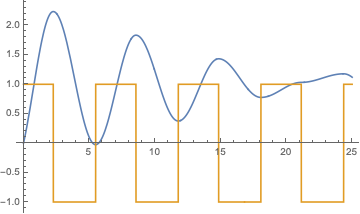
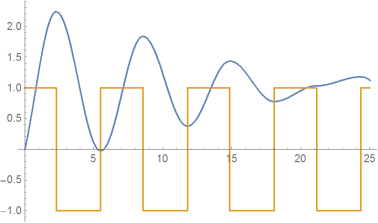
First make sure nothing changed:
Plot[Evaluate[{x[t], sgn[t]} /. sol], {t, 0, 25}]
Now we can plot the x[t] vs v[t]=x'[t] phase plane. The tricky part is there are two sets of streams depending on sgn[t]. I made the sgn[t]==1 streams blue and the sgn[t]==-1 ones gray.
{xmin, xmax} = {-0.2, 2.4}; {vmin, vmax} = {-1.2, 1.4};
sp1 = StreamPlot[{v, 1 - x - 0.05 (1 + x)},
  {x, xmin, xmax}, {v, vmin, vmax},
  StreamStyle -> Lighter[Blue, 0.5], PlotRangePadding -> 0];
sp2 = StreamPlot[{v, 1 - x + 0.05 (1 + x)},
  {x, xmin, xmax}, {v, vmin, vmax}, StreamStyle -> Gray];
Show[sp1, sp2, Graphics[Line[{{xmin, 0}, {xmax, 0}}]], FrameLabel -> {"x", "v=x'"}]
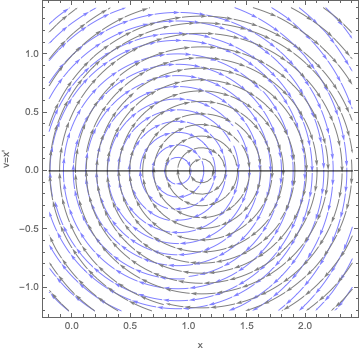
Well, that's an eye-full, but look along the v==0 line and notice that the blue and gray arrows agree in direction on the outside but in the middle they are pointed at each other.
Now plot the numerical solution and color-code it based on sgn[t]:
pp = ParametricPlot[{x[t], v[t]} /. sol, {t, 0, 25},
  ColorFunction -> Function[{x, y, t}, If[(sgn[t] /. sol) > 0, Blue, Black]],
  ColorFunctionScaling -> False, PlotStyle -> Thick];
Show[sp1, sp2, pp, Graphics[Line[{{xmin, 0}, {xmax, 0}}]], FrameLabel -> {"x", "v=x'"}]
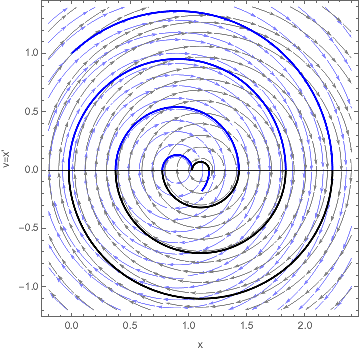
Zooming in on the interesting part:
{xmin, xmax} = {0.75, 1.2}; {vmin, vmax} = {-0.2, 0.2};
...
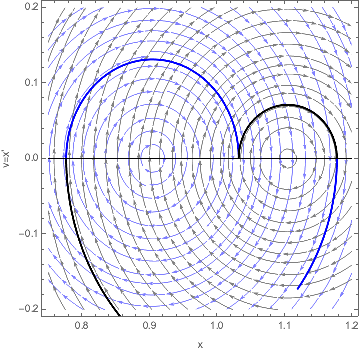
So I'd say that NDSolve is doing exactly what you asked: switch sgn[t] when x'[t]==0 and then carry on.
If you want one equation for v'[t] when Sign[v[t]]>0 and the other when Sign[v[t]]<0, why not just use Sign?
sol = NDSolve[{
     v'[t] == 1 - x[t] - .05 Sign[v[t]] (1 + x[t]),
     x'[t] == v[t],
     x[0] == 0, v[0] == 1}, {x, v}, {t, 0, 25}][[1]];

Plot[Evaluate[x[t] /. sol], {t, 0, 25}]
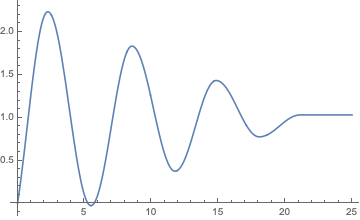
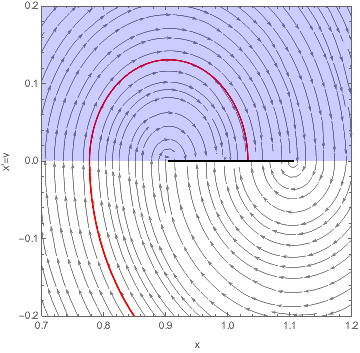
Here the solution gets trapped once it hits the region where the streams point at each other. We can find that region by solving where each vector field changes directions:
Solve[1 - x - 0.05 (1 + x) == 0, x]
Solve[1 - x + 0.05 (1 + x) == 0, x]
(* {{x -> 0.904762}} {{x -> 1.10526}} *)
Putting it together:
{xmin, xmax} = {0.7, 1.2}; {vmin, vmax} = {-0.2, 0.2};
Show[
  StreamPlot[{v, 1 - x - Sign[v] 0.05 (1 + x)},
  {x, xmin, xmax}, {v, vmin, vmax},
  StreamStyle -> Gray, StreamPoints -> Fine],
  ParametricPlot[{x[t], v[t]} /. sol, {t, 0, 25}, PlotStyle -> Red],
  Graphics[{Blue, Opacity[0.2], Rectangle[{xmin, 0}, {xmax, vmax}]}],
  Graphics[{Black, Thick, Line[{{0.904762, 0}, {1.10526, 0}}]}],
  FrameLabel -> {"x", "x'=v"},
  PlotRange -> {{xmin, xmax}, {vmin, vmax}}, PlotRangePadding -> 0
]

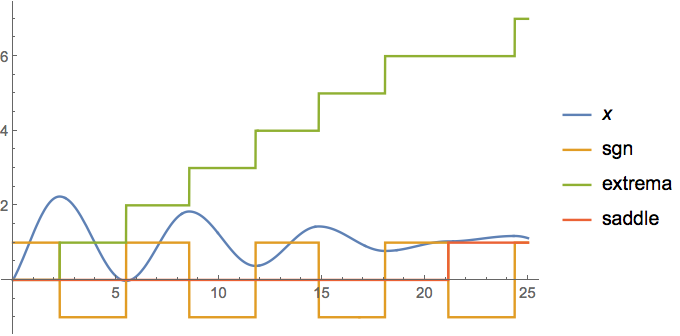


WhenEvent[x'[t] == 0 && x''[t] == 0, sgn[t] -> -sgn[t]]? $\endgroup$Plot[x''[t] /. sol, {t, 0, 25}]and the discrete change of sign inx''[t](i.e. such thatx''[t] != 0) that occurs aroundt~=21. It does not quite meet your definition of saddle. $\endgroup$WhenEvent[x''[t] == 0 && x'[t] == 0 , sgn[t] -> sgn[t] ]without success. $\endgroup$x''[t]disqualified it as a saddle or not. I was guessing that you would include it, but I wasn't sure. $\endgroup$