5
$\begingroup$

I have a list of directed edges:

list={1 \[DirectedEdge] 1, 1 \[DirectedEdge] 10, 2 \[DirectedEdge] 2, 
3 \[DirectedEdge] 3, 3 \[DirectedEdge] 5, 3 \[DirectedEdge] 7, 
3 \[DirectedEdge] 8, 3 \[DirectedEdge] 9, 3 \[DirectedEdge] 11, 
4 \[DirectedEdge] 4, 5 \[DirectedEdge] 2, 5 \[DirectedEdge] 5, 
5 \[DirectedEdge] 7, 5 \[DirectedEdge] 8, 5 \[DirectedEdge] 9, 
5 \[DirectedEdge] 11, 5 \[DirectedEdge] 14, 6 \[DirectedEdge] 1, 
6 \[DirectedEdge] 2, 6 \[DirectedEdge] 4, 6 \[DirectedEdge] 5, 
6 \[DirectedEdge] 6, 6 \[DirectedEdge] 7, 6 \[DirectedEdge] 8, 
6 \[DirectedEdge] 9, 6 \[DirectedEdge] 10, 6 \[DirectedEdge] 11, 
6 \[DirectedEdge] 12, 6 \[DirectedEdge] 13, 6 \[DirectedEdge] 14, 
6 \[DirectedEdge] 15, 6 \[DirectedEdge] 16, 6 \[DirectedEdge] 17, 
7 \[DirectedEdge] 7, 7 \[DirectedEdge] 9, 8 \[DirectedEdge] 8, 
8 \[DirectedEdge] 9, 8 \[DirectedEdge] 11, 8 \[DirectedEdge] 14, 
8 \[DirectedEdge] 16, 8 \[DirectedEdge] 17, 9 \[DirectedEdge] 9, 
10 \[DirectedEdge] 9, 10 \[DirectedEdge] 10, 11 \[DirectedEdge] 2, 
11 \[DirectedEdge] 8, 11 \[DirectedEdge] 9, 11 \[DirectedEdge] 11, 
11 \[DirectedEdge] 15, 11 \[DirectedEdge] 16, 11 \[DirectedEdge] 17, 
12 \[DirectedEdge] 9, 12 \[DirectedEdge] 12, 13 \[DirectedEdge] 9, 
13 \[DirectedEdge] 13, 13 \[DirectedEdge] 16, 13 \[DirectedEdge] 17, 
14 \[DirectedEdge] 14, 15 \[DirectedEdge] 9, 15 \[DirectedEdge] 15, 
16 \[DirectedEdge] 9, 16 \[DirectedEdge] 16, 17 \[DirectedEdge] 17};

I want to draw a histogram in the following structure. The list above consists of In- and Out-links, and I like to construct a histogram combining both In and Out link numbers with different colors in the bars of the histogram. For example, if 5 links go out of vertex 1 and 10 links come in to vertex 1, the bar associated with vertex 1 should have a height of 15. But then, I should be able to see the bars in two colors to visualize the In and Out sample.

I know that Degree, InDegree and OutDegree are the related functions for calculating the data that will be used in constructing the histogram, but I have no idea how I put them in the above structure.

The ideal (limited with my knowledge) solution is to write a Mathematica function, the argument of which is a list of directed edges.

Thank you for your time.

$\endgroup$

4 Answers 4

8
$\begingroup$

Updated to return chart of loop-free part

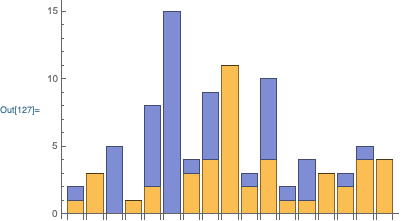
You can use BarChart for this (incorporating halmir's suggestions):

inOutGraph[e_] := With[{g = SimpleGraph @ Graph[Sort @ VertexList[e], e]},
    BarChart[
        Transpose @ Through @ {VertexInDegree, VertexOutDegree} @ g,
        ChartLayout -> "Stacked"
    ]
]

inOutGraph[list]

enter image description here

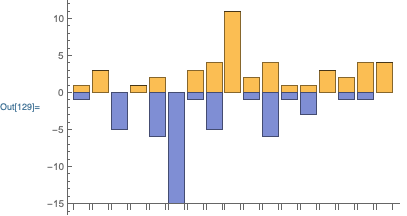
or:

inOutGraph[e_] := With[{g = SimpleGraph @ Graph[Sort @ VertexList[e], e]},
    BarChart[
        Transpose @ Through @ {VertexInDegree, Minus @* VertexOutDegree} @ g,
        ChartLayout -> "Stacked"
    ]
]

inOutGraph[list]

enter image description here

$\endgroup$
6
  • $\begingroup$ Very nice. You even chose the colors I was imagining. Thanks. $\endgroup$ Commented May 10, 2019 at 22:59
  • 1
    $\begingroup$ The BarChart does not appear to have the vertices in order. E.g. 3 has 1 in and 6 out but your chart shows a total of 5 for 3 instead if 7.. $\endgroup$
    – Edmund
    Commented May 10, 2019 at 23:05
  • $\begingroup$ @Edmund Thanks for letting me know $\endgroup$
    – Carl Woll
    Commented May 10, 2019 at 23:11
  • $\begingroup$ @Edmund: Yes, I was about to post the same question you raised. $\endgroup$ Commented May 10, 2019 at 23:13
  • 1
    $\begingroup$ @Edmund just define g = Graph[Range[17], list] and use it. $\endgroup$
    – halmir
    Commented May 11, 2019 at 1:44
7
$\begingroup$
g1 = SimpleGraph @ Graph[Range[17], list];
{ind, outd} = Through[{VertexInDegree, VertexOutDegree}[g1]];

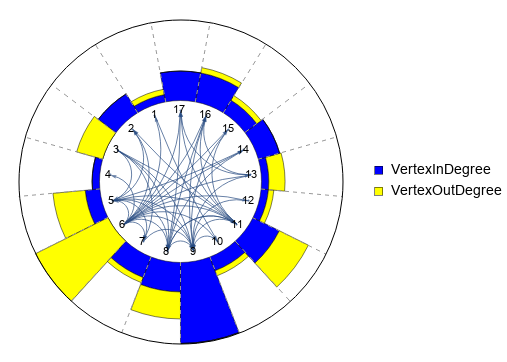
GraphComputation`GraphPropertyChart

GraphComputation`GraphPropertyChart[g1, Automatic -> {ind, outd}, 
 ChartStyle -> {Blue, Yellow}, VertexShapeFunction -> None, 
 VertexSize -> .75, VertexLabels -> Placed["Name", Center], 
 ChartLegends -> {"VertexInDegree", "VertexOutDegree"}]

enter image description here

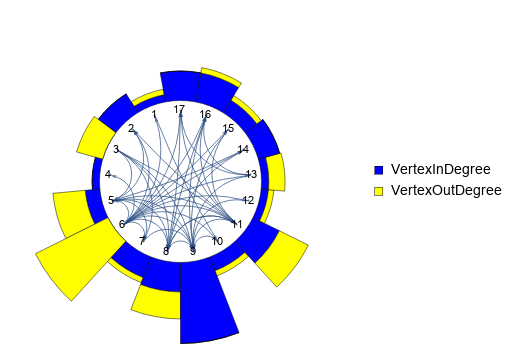
Add the options PolarGridLines->False and PolarAxes->False to get

enter image description here

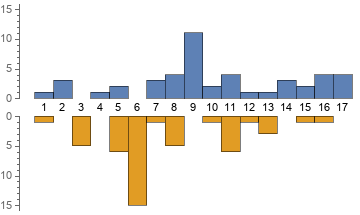
PairedBarChart

PairedBarChart[Style[#, ColorData[97][1]] & /@ ind, 
 Style[#, ColorData[97][2]] & /@ outd, BarSpacing -> {3, 0, 0}, 
 BarOrigin -> Top, ChartLabels -> Placed[Range[17], Axis]]

enter image description here

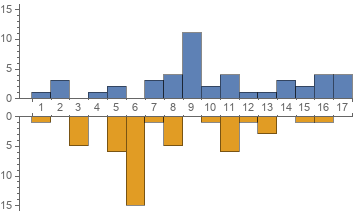
PairedHistogram + WeightedData

PairedHistogram[Style[WeightedData[Range@17, ind], ColorData[97][1]], 
 Style[WeightedData[Range@17, outd],  ColorData[97][2]], 17, 
 BarSpacing -> 3, BarOrigin -> Top, Axes -> {False, True}, 
 Epilog -> (Text[#, {#, 0}] & /@ Range[17])]

enter image description here

$\endgroup$
5
  • 1
    $\begingroup$ It is really excellent. I am amazed with your extended and very useful answers, which answered many other questions of mine. Thank you so much. $\endgroup$ Commented May 11, 2019 at 9:26
  • $\begingroup$ @Tugrul, my pleasure. $\endgroup$
    – kglr
    Commented May 11, 2019 at 9:32
  • $\begingroup$ With n=17 (number of vertices) a single vertex can have max of 32 links, excluding self loops. Can we set the size of the circle in your 1st polar histogram to 2(n-1)=32 so that I can easily identify those sectors performing the best in the given digraph? Thanks. $\endgroup$ Commented May 11, 2019 at 10:53
  • 1
    $\begingroup$ @Tugrul, it should be possible but it seems to be non-trivial (several things I tried with PolarAxes, PolarGridLines ... did not give the desired result.) $\endgroup$
    – kglr
    Commented May 11, 2019 at 12:56
  • $\begingroup$ Thank you for your trials. I appreciate it. Regards. $\endgroup$ Commented May 11, 2019 at 13:15
3
$\begingroup$

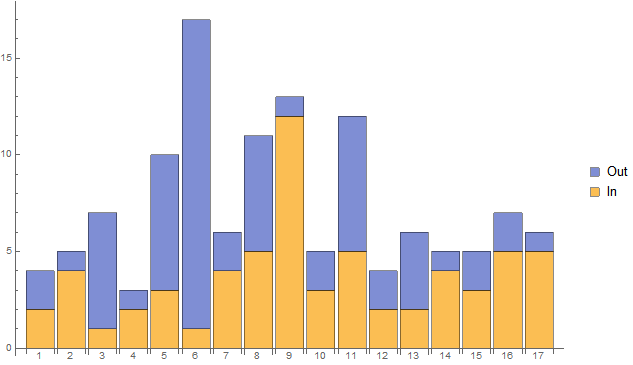
With ordered vertices

vl = VertexList@list;
degree = Association @@ Thread[{"In", "Out"} -> Through@{VertexInDegree, VertexOutDegree}@list];
degree = #[[Ordering[vl]]] & /@ degree;
vl = vl[[Ordering[vl]]];

BarChart[Transpose@Values@degree,
 ChartLayout -> "Stacked",
 ChartLabels -> {vl, None},
 ChartLegends -> SwatchLegend[Automatic, {"In", "Out"}]]

Mathematica graphics

Hope this helps.

$\endgroup$
1
  • $\begingroup$ and @Carl: Would be possible to exclude SelfLoops from the histogram? $\endgroup$ Commented May 10, 2019 at 23:26
2
$\begingroup$

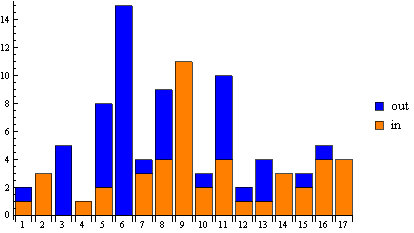
An alternative with ordered vertices, and self-loops removed:

listToCounts[list_] := Module[{l2, maxvertex, goingout, goingin},
   l2 = DeleteCases[list, (a_ \[DirectedEdge] a_)];
   maxvertex = Max[{l2[[All, 1]], l2[[All, 2]]}];
   goingout = Table[Count[l2[[All, 1]], vertex], {vertex, maxvertex}];
   goingin = Table[Count[l2[[All, 2]], vertex], {vertex, maxvertex}];
   Transpose[{goingin, goingout}]
   ];

counts = listToCounts[list]

{{1, 1}, {3, 0}, {0, 5}, {1, 0}, {2, 6}, {0, 15}, {3, 1}, {4, 5}, {11,0}, {2, 1}, {4, 6}, {1, 1}, {1, 3}, {3, 0}, {2, 1}, {4, 1}, {4, 0}}

BarChart[counts, ChartLayout -> "Stacked", ChartLegends -> {"in", "out"}, ChartStyle -> {Orange, Blue}, ChartLabels -> {ToString[#] & /@ Range[Max[{list[[All, 1]], list[[All, 2]]}]], None}]

enter image description here

$\endgroup$

Your Answer

By clicking “Post Your Answer”, you agree to our terms of service and acknowledge you have read our privacy policy.

Not the answer you're looking for? Browse other questions tagged or ask your own question.