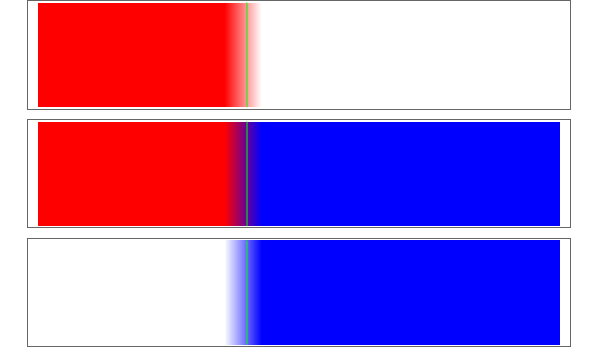
I've recently been playing around with ColorFunction and have run into a small snag. I'm ultimately looking to apply combinations of color schemes to the same data set. In the code below (simplified example), I want red for x < 0.4 and blue above.
line[x0_] := Line[{{x0, 0}, {x0, 0.2}}];
graphic[x0_, colorfunc_] :=
  DensityPlot[x, {x, 0, 1}, {y, 0, .2},
    AspectRatio -> Automatic,
    Frame -> True, FrameTicks -> None,
    ColorFunction -> (colorfunc &),
    Epilog -> {Green, line[x0]}]
GraphicsColumn[
  {graphic[0.4, If[# < 0.4, RGBColor[1, 0, 0], RGBColor[1, 1, 1]]],
   graphic[0.4, If[# > 0.4, RGBColor[1, 0, 0], RGBColor[0, 0, 1]]],
   graphic[0.4, If[# > 0.4, RGBColor[0, 0, 1], RGBColor[1, 1, 1]]]},
  ImageSize -> 600]
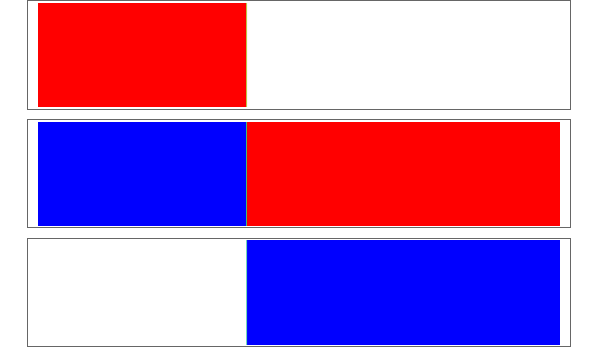
I'm curious as to why the boundaries seem so diffuse - I was looking for the output to look more along the lines of the following, with hard boundaries.
Is there something I'm missing that causes this behavior?
EDIT:
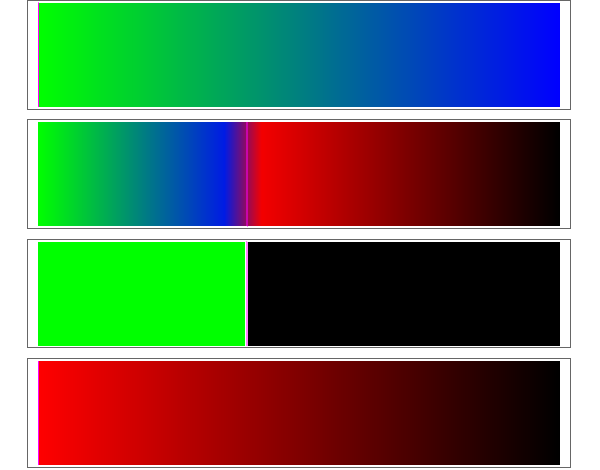
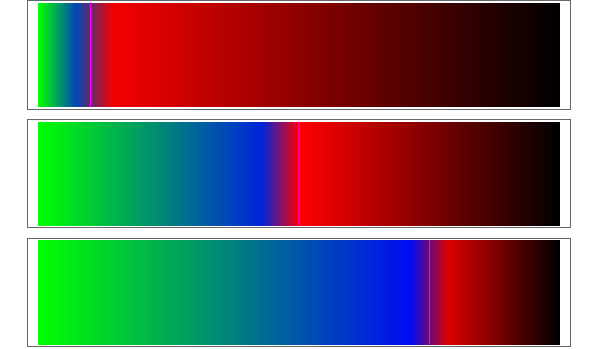
I originally started digging into this while playing around with Colorize, so the discontinuity that appears around x0 from m_goldberg's response would be worrisome.
graphic2[x0_, colorfunc_] :=
  DensityPlot[UnitStep[x - x0], {x, 0, 1}, {y, 0, .2},
  AspectRatio -> Automatic, Frame -> True, FrameTicks -> None,
  ColorFunction -> (colorfunc &), Epilog -> {Magenta, line[x0]}]

funcA[f_] := RGBColor[0, 1 - f, f];
funcB[f_] := RGBColor[1 - f, 0, 0];
funcAB[f_, x0_] := If[f < x0, funcA[f/x0], funcB[(f - x0)/(1 - x0)]];

GraphicsColumn[{
  graphic[0, funcA[#]],
  graphic[0.4, funcAB[#, 0.4]],
  graphic2[0.4, funcAB[#, 0.4]],
  graphic[0, funcB[#]]
  }]
So, perhaps a more accurate descriptor of what I'm looking at would be, how do I generate a custom 'composite' palette from existing gradients, with sharp boundaries?
The blending isn't necessarily the worst thing in the world (and certainly isn't without merit...), but in my mind that can (ie should) be incorporated by having the constituents overlap a designated amount.


