2
$\begingroup$

Okay, here is the information that I have.

closingValues = 
  FinancialData["^GSPC", "Close", {"Jan 1., 2000", "Jan 1., 2012"}, 
   "Value"];
logr = Differences[Log[closingValues]];

x = Tally[Sort[Round[logr, .001]]];

What I want to do is this:

(logr >= x) / Length[logr]

I want to count all the values in logr that are greater than or equal to x (there are about 110 or so values in x).

I also need help on plotting a graph where x is on the x-axis, and the resulting number above is on the y-axis.

Any help or advice, or leading me to any direction of solving my problem is greatly appreciated. Thank you.

$\endgroup$
4
  • $\begingroup$ What elements of "logr" and "x" are you trying to compare? The list x already consists of elements in logr, just rounded to the nearest 0.001. Are you trying to do an element by element compare? $\endgroup$
    – cartonn
    Commented Dec 5, 2012 at 1:02
  • $\begingroup$ What I'm trying to do is find typical values of logr, which i denoted x. And then count which values of logr are greater than x. I didn't know how to find "typical values" so I tallied all of the rounded values and am going to use those. $\endgroup$
    – user4341
    Commented Dec 5, 2012 at 1:09
  • $\begingroup$ If you are looking for values in logr that are greater than the max element in x (hence all elements in x), all you will find are the ones that were rounded down to the max value in x. Am I right? $\endgroup$
    – cartonn
    Commented Dec 5, 2012 at 1:12
  • $\begingroup$ Right. So let's say the max value was .05, then I want to find count all values in logr that are greater than .05, and then divide how ever many numbers I found that were greater than .05 by Length[logr]. But instead of using just the max value, I want to do it for all listed values in x. $\endgroup$
    – user4341
    Commented Dec 5, 2012 at 1:18

2 Answers 2

7
$\begingroup$

Perhaps use UnitStep and Mean. This should be pretty fast.

f[logr_, x_] := Mean[UnitStep[logr - x]]

f[logr, 0]

(*1597/3018*)

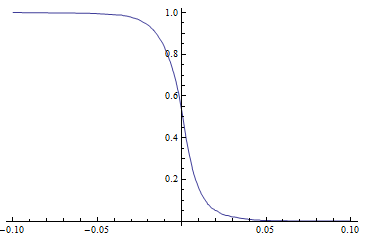
Now to plot it.

Plot[f[logr, t], {t, -.1, .1}, Exclusions -> None]

enter image description here

$\endgroup$
10
  • $\begingroup$ Andy, I don't think this is what I'm trying to do, but I greatly appreciate you trying to help. What I wanted to do is find all values in logr that is greater than the first value in x (so I essentially count however many values are larger than x), and then divide by the length of logr (like a probability). And then repeat with the next value in x. $\endgroup$
    – user4341
    Commented Dec 5, 2012 at 1:43
  • $\begingroup$ This counts all values in logr that are greater than a given x value and divides by the number of elements in logr. Is that not what you wanted? $\endgroup$
    – Andy Ross
    Commented Dec 5, 2012 at 1:49
  • $\begingroup$ Actually, this does what you want, much more easily than what I was doing. Hats off! $\endgroup$
    – cartonn
    Commented Dec 5, 2012 at 1:54
  • $\begingroup$ Ooh, my confusion lies in the := Mean[UnitStep[logr - x]] part. Could you explain what it is doing for me? $\endgroup$
    – user4341
    Commented Dec 5, 2012 at 1:58
  • 1
    $\begingroup$ UnitStep is listable and logr-x gives a list of numbers. If they are negative UnitStep gives 0 otherwise it gives 1. Mean of a list of zero's and 1's is the same as counting the non-negative values and dividing by the number of elements. $\endgroup$
    – Andy Ross
    Commented Dec 5, 2012 at 2:00
1
$\begingroup$

(Cannot connect to FinancialData, so I used fakeReturns instead of logr.)

 fakeReturns = RandomVariate[NormalDistribution[], 600];

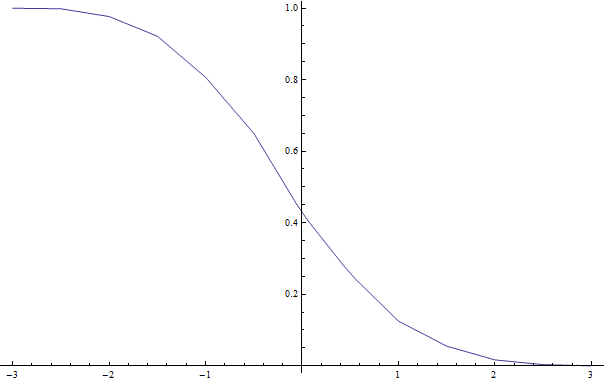
 Plot[SurvivalFunction[HistogramDistribution[fakeReturns], x], {x, -3, 3},
   Exclusions -> None]

enter image description here

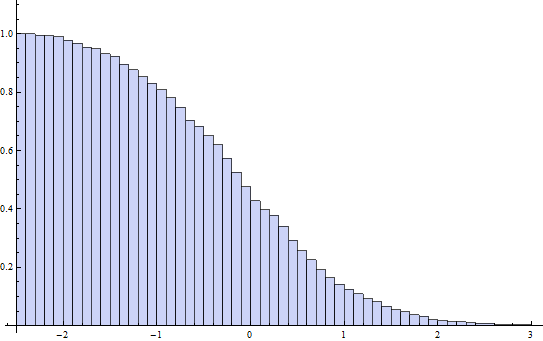
Or, Histogram with Round[logr,.001] ("typical values") as bin delimiters and "SF" (i.e., SurvivalFunction) as the height function gives:

Histogram[fakeReturns, {Union@Round[fakeReturns, 0.1]}, "SF", PlotRange -> Full]

enter image description here

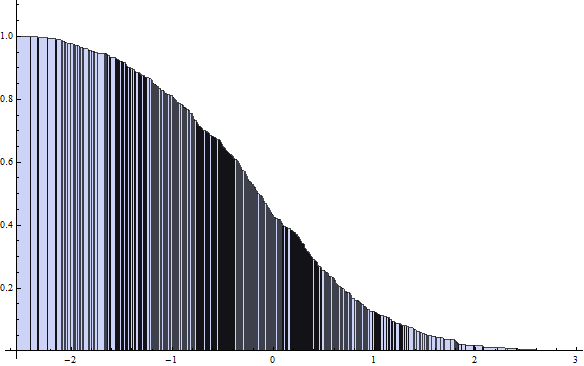
or, with a different specification of "typical" values:

 Histogram[fakeReturns, {Union@Round[fakeReturns, 0.01]}, "SF", PlotRange -> Full]

enter image description here

$\endgroup$
2
  • $\begingroup$ OOH! That seems simple also! Now what if I wanted to take the log of the resulting values and plot it with the log of the x values? How would I do that? $\endgroup$
    – user4341
    Commented Dec 5, 2012 at 3:21
  • $\begingroup$ @user4341, fakeReturns data has negative values as it is intended to represent your logr (Differences[Log[closingPrices]], that is, daily returns). With positive-valued data, you can use Histogram option ScalingFunctions -> {"Log", "Log"} get both axes in log scale. $\endgroup$
    – kglr
    Commented Dec 5, 2012 at 3:46

Your Answer

By clicking “Post Your Answer”, you agree to our terms of service and acknowledge you have read our privacy policy.

Not the answer you're looking for? Browse other questions tagged or ask your own question.