1
$\begingroup$

I want to determine the influence of factors on the outcome of a situation using LinearModelFit. I've tried to figure out how to do it by looking at online examples but I'm getting nowhere.

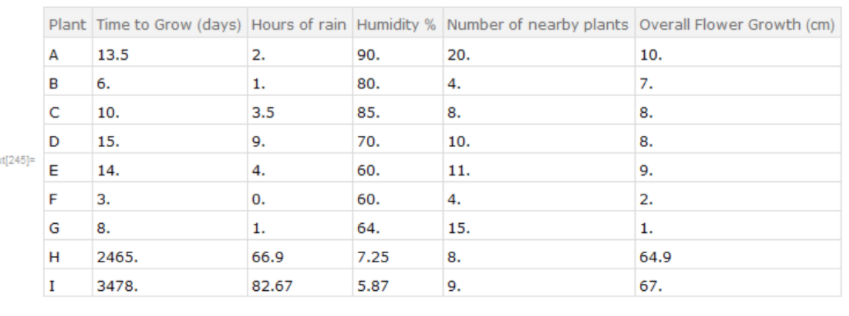
For example, taking the following data (these are completely made up values):

Plantdata

So I want to calculate the influence the four factors (time, rain, humidity, no. plants) have on the overall flower growth (row 6).

I know how to import the data and put it into table form but after that I get lost.

Can someone show me how I would make this into a LinearModelFit and finally a ParameterTable which shows me the influence of each factor.

Out of curiousity, are there other ways of indicating the impact of factors?


Edit:

I have tried to implement the classifier method, I believe I have got the first phase of the classifier training method but I'm not sure where to go from here since I'm using my own data set and not ExampleData.

flowertab = SemanticImport["https://s3.us-east-2.amazonaws.com/flowername1/flower1.xlsx"]

flower3

flowerflow = Normal@flowertab[All, Sequence[Most@# -> Last@#] &]

flower4

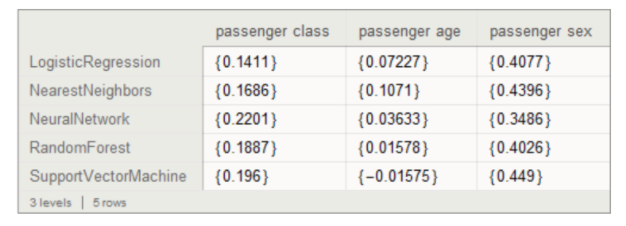
How to I apply my data to the titanic method:

testSetName = "Titanic"; 
trainingSet = 
  ExampleData[{"MachineLearning", testSetName}, "TrainingData"];
 testSet = ExampleData[{"MachineLearning", testSetName}, "TestData"];
varNames = 
  Flatten[List @@ 
    ExampleData[{"MachineLearning", testSetName}, 
     "VariableDescriptions"]];

mres = Association@Map[
    Function[{clMethod},
     cf = Classify[trainingSet, Method -> clMethod];
     accRes = 
      AccuracyByVariableShuffling[cf, testSet, varNames, 
       "FScoreLabels" -> "survived"];
     clMethod -> (accRes[None] - Rest[accRes])/accRes[None]
     ], {"LogisticRegression", "NearestNeighbors", "NeuralNetwork", 
     "RandomForest", "SupportVectorMachine"}] ;

Dataset[mres]

to finally get

mres = Association@Map[
    Function[{clMethod},
     cf = Classify[trainingSet, Method -> clMethod];
     accRes = 
      AccuracyByVariableShuffling[cf, testSet, varNames, 
       "FScoreLabels" -> "survived"];
     clMethod -> (accRes[None] - Rest[accRes])/accRes[None]
     ], {"LogisticRegression", "NearestNeighbors", "NeuralNetwork", 
     "RandomForest", "SupportVectorMachine"}] ;

Dataset[mres]

titanic3

$\endgroup$
6
  • $\begingroup$ One way is to use Classify and this guide for variables importance investigation. Also, see the related discussion "How can I determine the importance of variables from Classify?". $\endgroup$ Commented Mar 23, 2018 at 15:13
  • $\begingroup$ If by "influence" you mean a measure for each data point as to their level of "influence", look at the LinearModelFit documentation for "CookDistances". $\endgroup$
    – JimB
    Commented Mar 23, 2018 at 18:42
  • $\begingroup$ @AntonAntonov I've spent the evening reading those articles and attempting that method, they're very very helpful thank you! However I'm having trouble applying it to my data and have edited my question, could you help? (Sorry it's quite long winded) $\endgroup$
    – hellohi
    Commented Mar 23, 2018 at 23:25
  • $\begingroup$ @hellohi Please post your data! $\endgroup$ Commented Mar 24, 2018 at 0:23
  • $\begingroup$ @AntonAntonov apologies, I've posted it under the edit $\endgroup$
    – hellohi
    Commented Mar 24, 2018 at 9:32

1 Answer 1

2
$\begingroup$
data = {{13.5, 2, 90, 20, 10}, {6, 1, 80, 4, 7}, {10, 3.5, 85, 8, 
   8}, {15, 9, 70, 10, 8}, {14, 4, 60, 11, 9}, {3, 0, 60, 4, 2}, {8, 
   1, 64, 15, 1}};
lmf = LinearModelFit[data, {1, a, b, c, d}, {a, b, c, d}];
lmf["ANOVATable"]

This is the simple linear model fit in each of the input parameters (rows 2-5), listed as variables a, b, c, and d respectively, and the ANOVA table describing their effects. This is the simple linear model assuming that the effects of each input are completely independent and the presence of a constant term, see the documentation of LinearModelFit for alternatives.

Also see lmf["Properties"] from this example for other information available automatically from Mathematica's LinearModelFit.

$\endgroup$
6
  • $\begingroup$ Amazing, thank you! Just to double check, this model fit is indeed measuring the effects they have on the results in the 6th row? :) $\endgroup$
    – hellohi
    Commented Mar 24, 2018 at 13:54
  • 2
    $\begingroup$ @hellohi Yes, this model is fitting the 4 parameters to the last element of each entry in the data table. $\endgroup$
    – eyorble
    Commented Mar 24, 2018 at 16:23
  • $\begingroup$ @eyeorble Sorry may I ask another question? I'm a little confused about the p-values of the parameter table and I'm finding conflicting information. If the p-value is, say, 0.9 I can assume this has a higher influence on the selected row than a factor with a p-value of 0.01? $\endgroup$
    – hellohi
    Commented Mar 25, 2018 at 19:26
  • $\begingroup$ @hellohi Generally p-values are the probability that a variable is insignificant, so a p-value of 0.9 generally means that the variable has little to no influence on the resulting model, while 0.01 generally means that it has a relatively significant influence. $\endgroup$
    – eyorble
    Commented Mar 25, 2018 at 23:24
  • 1
    $\begingroup$ @Titus Yes, that should work. The documentation has some examples for that use case (under the Scope heading). However, if you have more specific questions about LinearModelFit, please consider asking a separate question here. In general the dependent variable is in the last position. $\endgroup$
    – eyorble
    Commented May 20, 2019 at 17:44

Your Answer

By clicking “Post Your Answer”, you agree to our terms of service and acknowledge you have read our privacy policy.

Not the answer you're looking for? Browse other questions tagged or ask your own question.