1
$\begingroup$

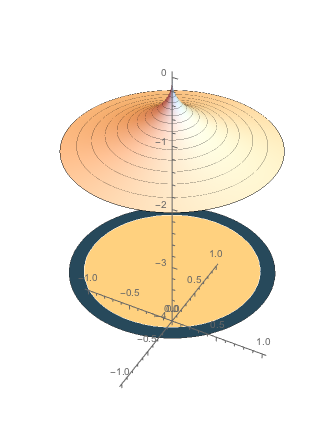
Here is a 3D hacked-together plot:

 f[x_, y_] := -(x^2 + y^2)^.2;
 min = -1;
 max = 0;
 surface =  Plot3D[f[x, y], {x, -1, 1}, {y, -1, 1}, PlotRange -> {min,   max},  
ClippingStyle -> None, MeshFunctions -> {#3 &}, Mesh -> 15, 
   MeshStyle -> Opacity[.5], Boxed -> False, Axes -> False, 
   PlotPoints -> 200, PlotStyle ->  White];
slice = SliceContourPlot3D[f[x, y], 
   z == min - 2, {x, -5, 5}, {y, -5, 5}, {z, min - 2, min + 2}, 
   PlotRange -> {min, max}, Axes -> True, PlotPoints -> 200, 
   PlotRangePadding -> 0, Boxed -> False, PlotPoints -> 200, 
   Contours -> 20, ContourStyle -> White];
Show[surface, slice, PlotRange -> All, BoxRatios -> {1, 1, 1.4}, 
 Axes -> True, AxesOrigin -> {0, 0, -4}]
Mathematica graphics

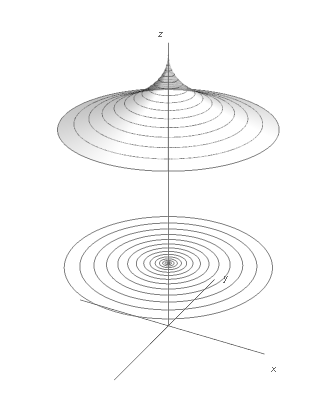
I would like to change the colors to neutral ones on the surface and its projection. Furthermore, I would like to have neater contour lines on the surface and on the projection, to have some contours in the projection where there currently are none and, finally, labels on the axes.

Surely these questions have been asked before, but I can't find them.

$\endgroup$

1 Answer 1

3
$\begingroup$

First of all, one quick point: SliceContourPlot3D is intended to depict 4D information as a contour onto a parametric 3D surface. Your function is a 3D surface, and not suitable for use with SliceContourPlot3D.

What you appear to want is a way to project the contours generated with your mesh function in Plot3D onto the z = -3 plane.

As far as I know, Mathematica does not have a built in method for this, but with some spelunking into the graphics structures you can make your own. The key function to inspect Mathematica output is FullForm. Apply FullForm to your surface object and you will see that it is a Graphics3D object with a GraphicsComplex as its first element. The GraphicsComplex is set up so that all the coordinate data is in one big table at the start, and primitives within the complex index into that coordinate table.

Here is a little example of one way to make your plot with the projected contours. There is probably a more elegant way of doing this.

With[{zproj=-3},
    Module[{f,surface,graphicsComplexPts,contourParts,contourProjPts,projection},
        f[x_,y_]:=-(x^2+y^2)^.2;
        surface=Plot3D[f[x,y],{x,-1,1},{y,-1,1},PlotRange->{-1,0},ClippingStyle->None,
            MeshFunctions->{#3&},Mesh->15,MeshStyle->Opacity[.5],Boxed->False,Axes->False,
            PlotPoints->200,PlotStyle->{Opacity[0.5],Gray},Lighting->"Neutral"];
        (* Plot3D returns a Graphics3D object with a GraphicsComplex, first element of which is a list of points *)
        graphicsComplexPts=surface[[1,1]];
        (* Find Line heads within GraphicsComplex *)
        contourParts=Position[surface,_Line];
        (* using GraphicsComplex indexing, map to projected contours. *)
        contourProjPts[k_]:=graphicsComplexPts[[
            surface[[Sequence@@contourParts[[k]],1]]
        ]]/.{x_,y_,z_}->{x,y,zproj};
        (* make projection with graphics primitives *)
        projection=Graphics3D[{Table[Line@contourProjPts[k],{k,1,Length@contourParts}]}];
        Show[{surface,projection},PlotRange->{All,All,{zproj-1,0.1}},BoxRatios->{1,1,1.4},
            Axes->True,AxesOrigin->{0,0,zproj-1},Ticks->None,AxesLabel->{x,y,z}]
    ]
]

enter image description here

$\endgroup$
1
  • $\begingroup$ Thanks a lot user7739 $\endgroup$ Commented Jan 26, 2018 at 4:32

Your Answer

By clicking “Post Your Answer”, you agree to our terms of service and acknowledge you have read our privacy policy.

Not the answer you're looking for? Browse other questions tagged or ask your own question.