The short answer is: I don't think it is built to always work for general distributions (though see Sjoerd C. de Vries's answer and continuous example below).
You might also want to have a look at the nice tutorial how to Create Your Own Distribution
with Oleksandr Pavlyk.
Lets see what are your options
Mixture
For mixture distributions, following J. M., we can define a mixture as:
DD[μ_, ν_, a_, b_] =
               MixtureDistribution[{a, b}, {PoissonDistribution[μ], PoissonDistribution[ν]}]
so that
RandomVariate[DD[4, 3, 1, 2], 16]

(* {5, 5, 6, 3, 5, 7, 9, 1, 3, 7, 5, 5, 3, 5, 2, 3} *)
Transformation
One can also use TransformedDistribution to define a new distribution from a
known one, and draw from it:
RandomVariate[TransformedDistribution[x - 4,
  x \[Distributed] PoissonDistribution[10]] // Release, 15]
Draw via Cumulative Distrubution
For a set of distributions for which the cumulative distribution exists, within which your example falls (though it probably differs from what you really want to do), the inverse of the cumulative distribution can be used to define a draw:
 CDF[custom[a], x]

 (* Gamma[1 + Floor[x], a]/Gamma[1 + Floor[x]] *)
So for instance,
  g[x_] = CDF[custom[10], x];
  h = Table[{g[x], x}, {x, 0, 40}] // N // Interpolation[#, InterpolationOrder -> 0] &;
which allows us to define the inverse of the CDF:
  h /@ (RandomReal[{0, 1}, {12}])

  (*  {12., 15., 6., 17., 12., 8., 6., 9., 8., 13., 13., 12.} *)

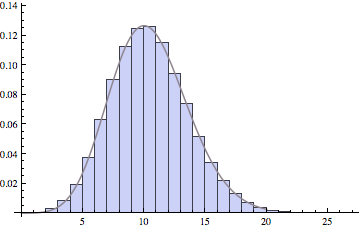
  Show[h /@ (RandomReal[{0, 1}, {125000}]) // Histogram[#, Automatic, "Probability"] &,
       Plot[PDF[custom[10], x - 1/2], {x, 0, 20}]]

Empirical Distribution
For a more general class of distribution, there is a twisted route within the current set of existing Mathematica functions: if you can draw samples which satisfy the distribution, then you can derive an EmpiricalDistribution (thanks J. M.) from your sample and then draw through it. It might be useful if it's costly to draw in the first place.
Continuous distribution where ProbabilityDistribution works with Random Variate
norm = Integrate[Exp[-x^2]/(c^2 + x^2), {x, -Infinity, Infinity},Assumptions -> c > 0];
DD[c_] = ProbabilityDistribution[1/norm Exp[-x^2]/(c^2 + x^2),
  {x, -Infinity,Infinity},Assumptions -> c > 0];
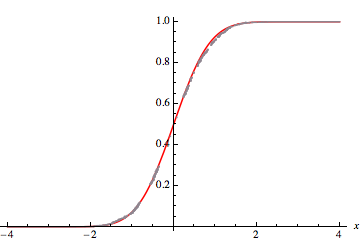
Let's check that the random variate sample is consistent
 data =RandomVariate[DD[4], 1500];

 DDE = EmpiricalDistribution[data];
 {Plot[CDF[DD[4], x] // Release, {x, -4, 4},PlotStyle -> Directive[Red]],
  Plot[CDF[DDE, x], {x, -4, 4}]} // Show

Note that it can involve more than one parameter:
 norm = Integrate[Exp[-β x^2]/(c^2 + x^2),{x,-Infinity,Infinity},Assumptions->{c > 0, β>0}];
 DD[c_, β_] = ProbabilityDistribution[1/norm Exp[-β x^2]/(c^2 + x^2),
  {x, -Infinity, Infinity}, Assumptions -> (c > 0 && β > 0)];

 RandomVariate[DD[1, 1], 4]

 (* {0.149204,-0.644442,-0.632239,-0.266628} *)
Final Note
For 2D generalization see RandomVariate from 2-dimensional probability distribution


TransformedDistributionas inRandomVariate[ TransformedDistribution[x - 1, x \[Distributed] NormalDistribution[]] // Release, 15]$\endgroup$MixtureDistribution[]already? $\endgroup$RandomVariate[]is not equipped to handle arbitrary discrete probability distributions; in general, you might have to roll your own algorithm. $\endgroup$RandomVariate[\[ScriptCapitalD], 15]from reference.wolfram.com/mathematica/ref/… works though? $\endgroup$Show[Plot[PDF[\[ScriptCapitalD], x], {x, -5, 5}], RandomVariate[\[ScriptCapitalD], 1500]//Histogram[#, Automatic, "Probability"]&]$\endgroup$