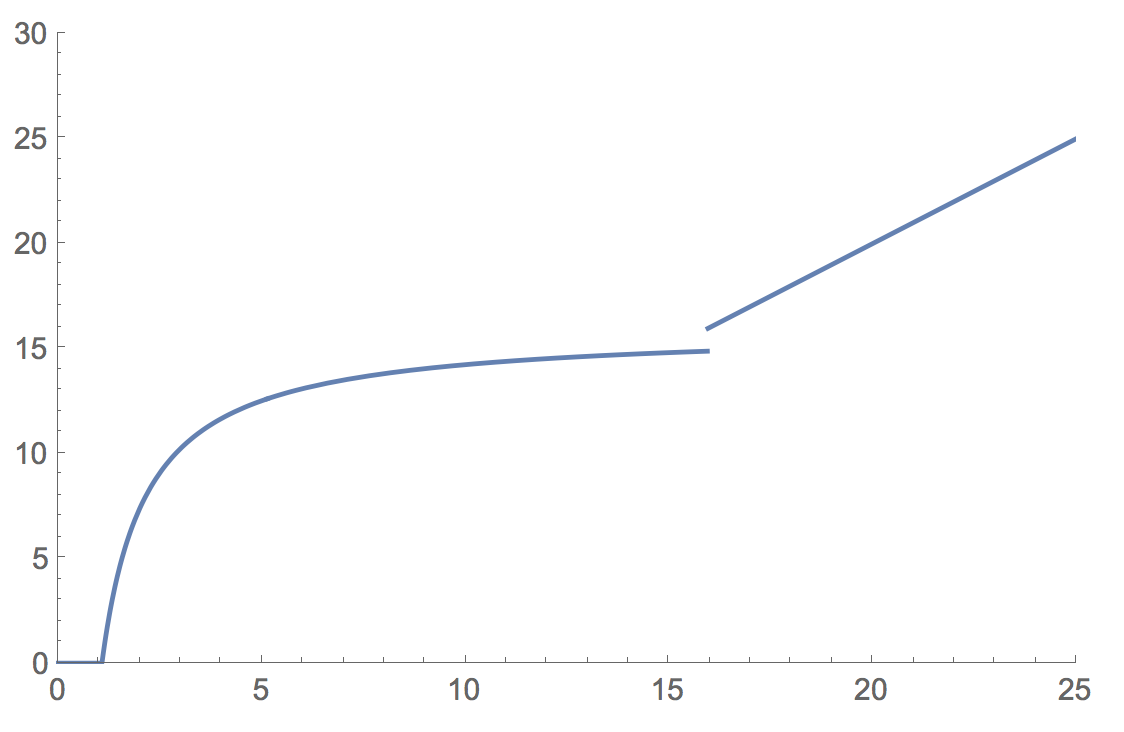
This is just to highlight another aspect of the other answer given. I would have expected a linear progression from the definition. I.e., if Precision[n]=p then we'd expect the switch point for CompareNumeric[x, n, n+epsilon] to be p. And this holds once you get past $MachinePrecision. Probably happens when Mathematica has to go from 64 bit numbers to whatever its internal infinite-precision numeric is. We can see this here:
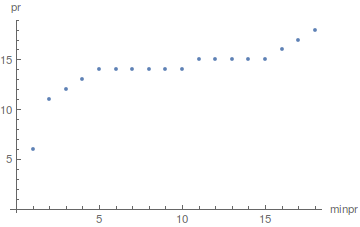
pr[x_] :=
  SelectFirst[
   Range[1, 100, .1],
   Internal`CompareNumeric[#, SetPrecision[1.1`, x], 1.2`100] == 0 &
   ];

Show[
 Plot[x, {x, 0, 25}, PlotStyle -> Gray],
 {#, pr@#} & /@ Range[1, 25, .01] // ListPlot
 ]
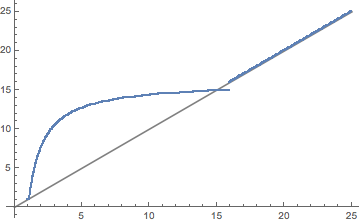
I looked at the part for n < $MachinePrecision and thought: "oh, a log-type function (probably log2)". But no simple scaling on Log2 worked for me.
Show[ListLinePlot@Table[Table[x*N@Log2[n], {n, 15}], {x, 5}],
 ListPlot[{#, pr@#} & /@ Range[1, 15, .01]]]
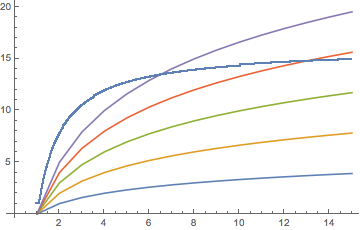
So maybe someone else can tackle what sort of pre-form that is. Once we have that we can probably piece back how Mathematica is interpreting things for its sub-machine precision numbers.
Update
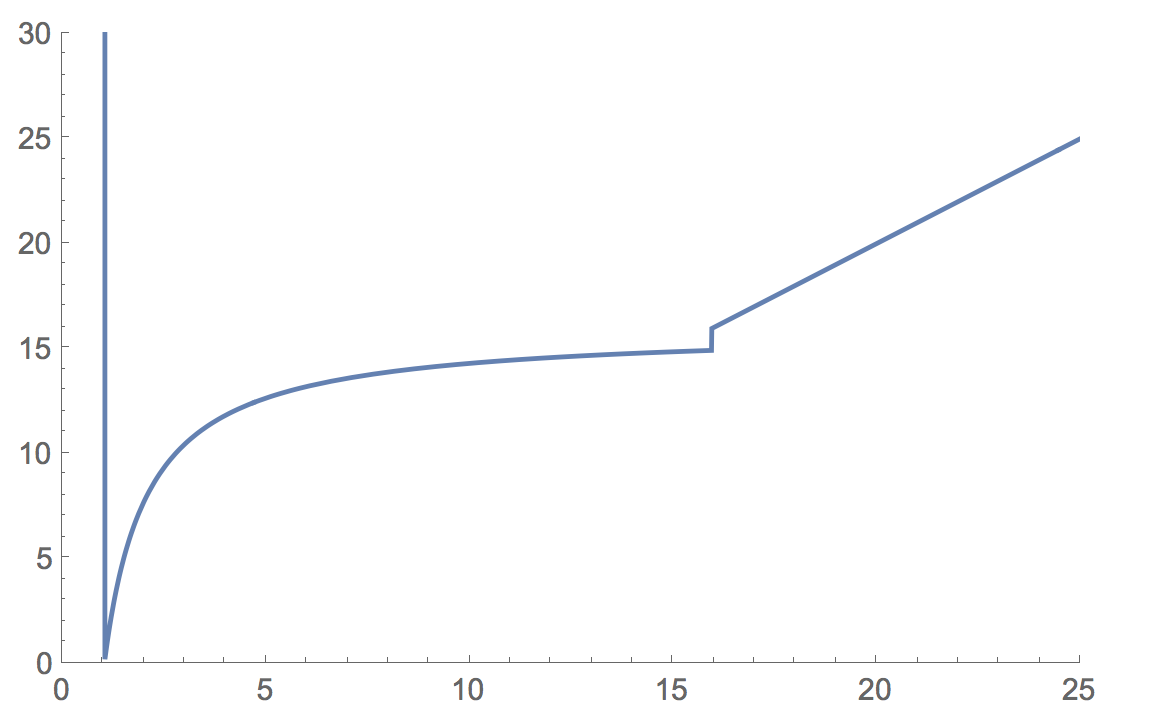
As found by happy fish, $MachinePrecision - $MachinePrecision/x fits this really well:
Plot[{
  pr[x],
  $MachinePrecision - $MachinePrecision/x
  },
 {x, 1, $MachinePrecision}
 ]
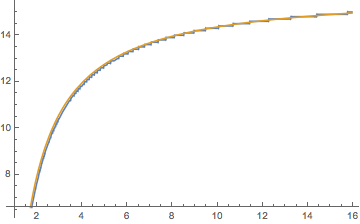
Noting that $MachinePrecision is 53Log10[2] by simple log rearrangements we have Log10[2^(53*(1 - 1/x))]. Since $MachinePrecision comes from how a 64 bit number is stored (there are 53 bits of precision), this could be saying it's using 53*(1 - 1/x) bits of precision for these numbers with Precision specified below $MachinePrecision. Why that would be, I have no idea. But it's a possibility.
Update 2
Shadowray points out this is even odder when you have fewer points of precision available before they would be equivalent
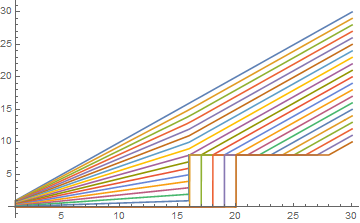
For example, make pr multivariate:
pr[x_, y_: 1] :=
  SelectFirst[
   Range[1, 100, .1],
   With[{
     a = SetPrecision[1. + (10^(-y)), x],
     b = SetPrecision[1. + (2*10^(-y)), 100]
     },
    Internal`CompareNumeric[#, a, b] == 0 &
    ]
   ];
Now plotting this for different amounts of reduction:
Show[
 Plot[x, {x, 0, 25}, PlotStyle -> Gray],
 Table[
   {#, pr[#, n]} & /@ Range[1, 25, .05],
   {n, 17}
   ] // ListPlot
 ]
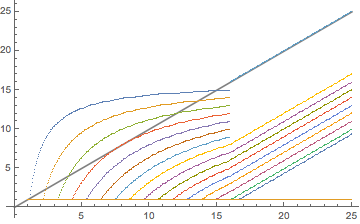
Note that the first 6 curves actually continue. They just jump up to y=x after $MachinePrecision (as I would naively have predicted).
If we use a near-continuous change:
Show[
 Plot[x, {x, 0, 25}, PlotStyle -> Gray],
 Table[
   {#, pr[#, n]} & /@ Range[1, 25, .05],
   {n, Range[1, 17, .1]}
   ] // ListPlot
 ]
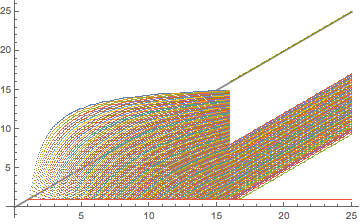
The pre-discontinuity part can still be easily formulated:
Show[
 Plot[x, {x, 0, 25}, PlotStyle -> Gray],
 Plot[
  Evaluate@Table[$MachinePrecision (1 - n/x),
    {n, 16}],
  {x, 1, $MachinePrecision}],
 Table[
   {#, pr[#, n]} & /@ Range[1, 25, .1],
   {n, 17}
   ] // ListPlot
 ]
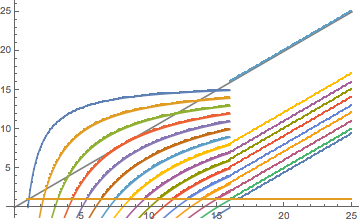
What's happening at the discontinuities is somewhat less clear. Note that the oddity at 17 is from the fact that 10^-17 is smaller than 10^-$MachinePrecision and so the system just treats the addition as doing nothing. The jumps need more explanation though.
In any case, if we return to the storage argument, now we have 53 n/x bits being dropped, assuming the interpreting the pre-jump part of the curves as showing Log10[2^(53 (1 - n/x))] is valid.


Internal`CompareNumeric[1, 11`2, 12`2]still gives-1. $\endgroup$-1and0is around7.3456427360042$\endgroup$Internal`CompareNumeric[n,a,b]basically answers the question, "how doaandbrelated ignoringnpoints of precision". So if you have two numbers and drop$MachinePrecisionpoints of precision it's basically comparing them at the integer level. e.g.Internal`CompareNumeric[IntegerPart@$MachinePrecision, 2.1, 2](because my$MachinePrecisionisn't an int) gives 0, butInternal`CompareNumeric[IntegerPart@$MachinePrecision - 1, 2.1, 2]gives 1. $\endgroup$Internal`CompareNumericgive an error message whenprecis set smaller than$MinPrecision? $\endgroup$