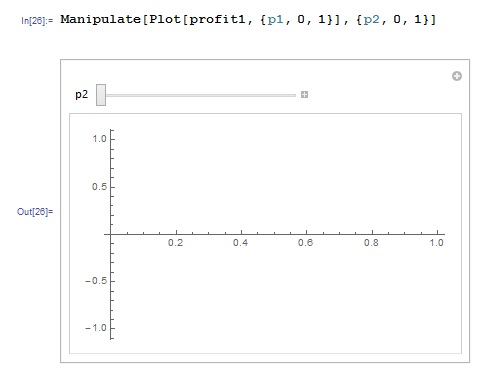
I want to plot a piecewise function with two variables using Manipulate command, but I am having trouble with it.
The function I want to plot is profit1. (details of the code can be found below)
z1 = Piecewise[{{Min[x1, 1 - p1], p1 < p2}, {Min[x1, Max[(1 - p1)/2, 1 - p1 - x2]], p1 == p2}, {Min[x1, Max[0, 1 - p1 - x2]], p1 > p2}}];
z2 = Piecewise[{{Min[x2, 1 - p2], p2 < p1}, {Min[x2, Max[(1 - p2)/2, 1 - p2 - x1]], p2 == p1}, {Min[x2, Max[0, 1 - p2 - x1]], p2 > p1}}];
profit1 = (p1 - c)*z1;
profit2 = FullSimplify[Integrate[1 - z, {z, 0, z1 + z2}] - c (z1 + z2)];
Values of x1, x2, and c are known and as follows: x1 = 1; x2 = 0.4; c = 0
When I try to use Manipulate to plot profit one:
Manipulate[Plot[profit1, {p1, 0, 1}], {p2, 0, 1}]
I get an empty graph like the one above. Any recommendations on how to fix this problem?
Thank you very much in advance.


profit1[p1_, p2_] := ...$\endgroup$