The problem is that the plot already included Opacity directives when mesh lines are drawn, so that one would have to change their opacity using a replacement rule, separately from the opacity of the gradient.
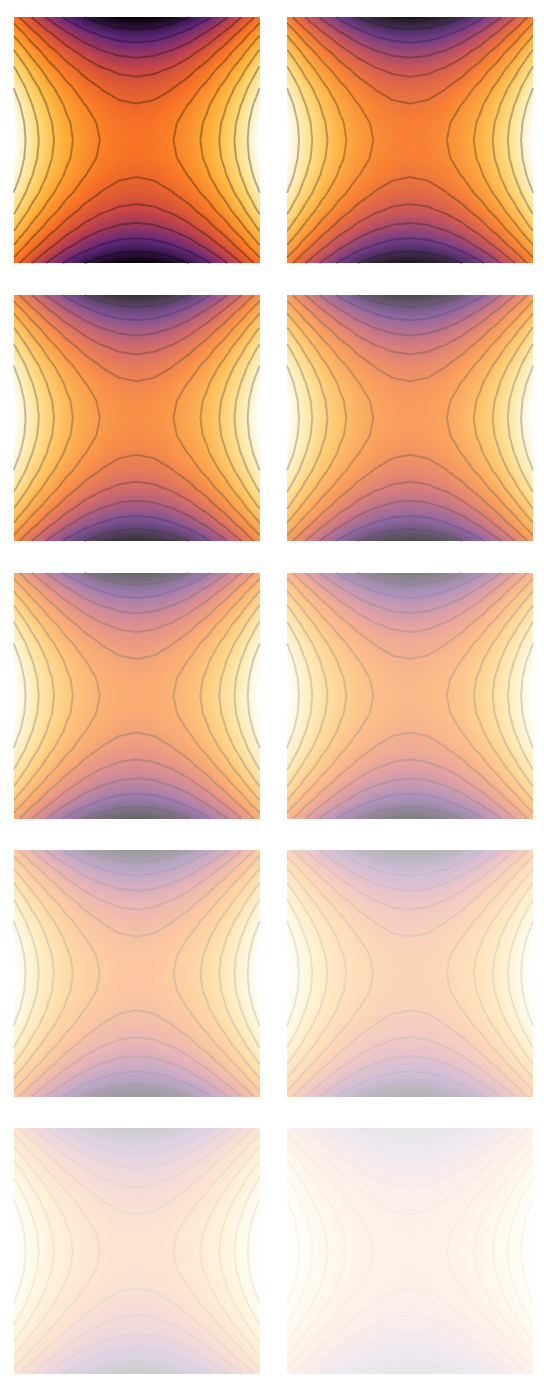
Instead, I would suggest achieving the same effect by just putting a blank Inset on top of your plots, with an opacity that varies in the opposite direction as what you want to see of you plot:
d = DensityPlot[x^2 - y^2, {x, -1, 1}, {y, -1, 1},
   ColorFunction -> "SunsetColors", Frame -> False,
   MeshFunctions -> {#3 &, #3 &}, Mesh -> 10, ImageSize -> 200,
   AspectRatio -> 1];

With[{bgColor = White},
 GraphicsGrid[Table[
    Show[d,
     Epilog ->
      Inset["", Automatic, Automatic, Scaled[1],
       Background -> Directive[Opacity[i], bgColor]]], {i, 0, 1, .1}]~
   Partition~2]]

Here, I gave the Inset a background of the same color as the paper (White). The last argument of Inset is used to expand it to the size of the enclosing plot. For more control, I also decided to add ImageSize and AspectRatio specifications to the plot d.


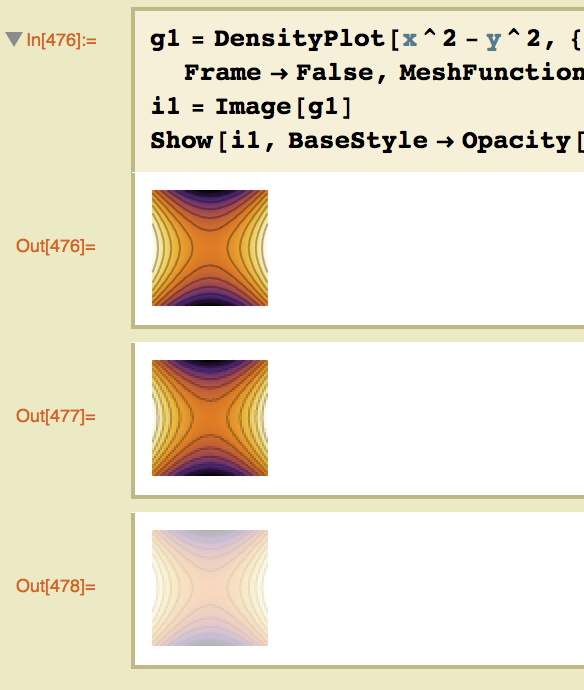
DensityPlotis calledplot, then:plot /. Graphics[a_, b___] :> Graphics[{Opacity[0.1], a}, b]. $\endgroup$DensityPlot[x^2 - y^2, {x, -1, 1}, {y, -1, 1}, ColorFunction -> "SunsetColors", Frame -> False, BaseStyle -> Opacity[0.1]]$\endgroup$HeadofGraphics, or be a graphics object of the kind that goes inside aGraphics? $\endgroup$plot/. GrayLevel[__] -> Opacity[n]where plot, n are symbol of plot and desired opacity is a QND way to get it done. $\endgroup$