3
$\begingroup$

I'm inspecting the Cantor pairing function, that we can find on this link here.

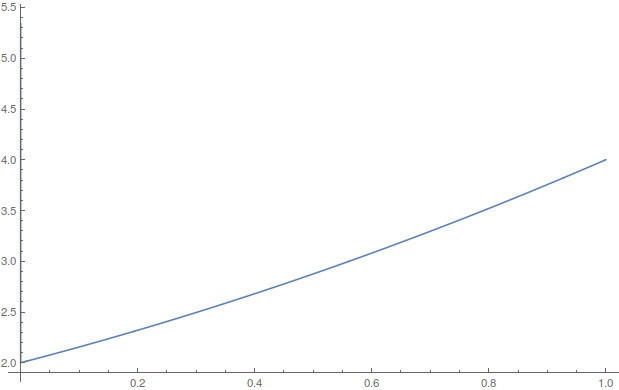
But the strange thing is that Mathematica is outputting a wrong result to me. The code below shows the strange behavior. When we plot the Q2N1 function, the $y$-axis does not corresponds to the correct value. See:

Q2N0[q_] := (Numerator[q] + Denominator[q] + 1)
            (Numerator[q] + Denominator[q])/2 + Denominator[q]

Q2N[q_] := Q2N0[Rationalize[q]]

Q2N1[q_] := Q2N[N[q, 10]]

Q2N1[0.2]

Out[13]= 26

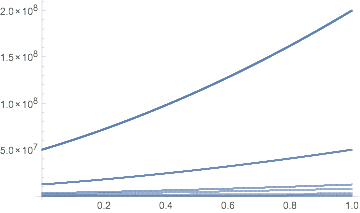
Plot[Q2N1[x], {x, 0, 1}]

the plot

As we can see, confronting the code with the plot, when x = 0.2 the correct value is 26, but Mathematica plot function returns a value near of 2.25. The truth is all returned values should be integers or very near to integers, so 2.25 could never be a result. Crazy.

Why this is happening? And, how can we have the correct output?

Edit

I think that I reached a plot with Mathematica, using some ideas presented in the answers. Looks like the problem was with Rationalize. Doing some tests I have found that need to pass a 0 argument, without it the function 'ignores' Rationalize. See below:

Q2N0[q_] := (Numerator[q] + Denominator[q] + 1)
            (Numerator[q] + Denominator[q])/2 + Denominator[q]

Q2N1[q_] := Q2N0[Rationalize[q, 0]]

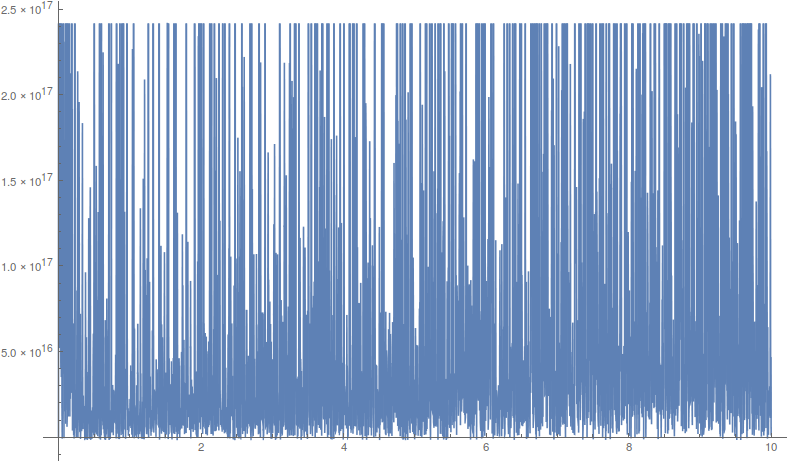
Plot[Q2N1[x], {x, 0, 10}]

plot again

But I'm still having a problem. FindRoot now brings a strange result. Crazy bis =)

Let's see:

In[125]:= Rationalize[5.588723439378913`, 0]

Out[125]= 97873229/17512627

In[127]:= Q2N1[5.588723439378913`]

Out[127]= 6656947957631923

In[130]:= FindRoot[Q2N1[x] == 26, {x, 0.1}]

Out[130]= {x -> 5.58872}

But Q2N1 is a bijection and Q2N1[x] == 26 when x is 0.2. Even if was not a bijection, Q2N1[5.588723439378913] evaluates to 6656947957631923 instead of 26. (See that when I copied and paste 5.58872, Mathematica paste 5.588723439378913 instead of 5.58872).

So, how can we manipulate this function that it will plot OK (already achieved as looks like) and the FindRoot will find the correct root (or at least try it, instead of brings some strange 5.58872 result?

$\endgroup$
6
  • $\begingroup$ What should the result look like? $\endgroup$
    – bbgodfrey
    Commented Apr 15, 2016 at 21:54
  • $\begingroup$ I have edited. I think now is a bit clear. $\endgroup$
    – GarouDan
    Commented Apr 15, 2016 at 21:57
  • $\begingroup$ Q2N is not continuous. Although Q2N[.2] is 26, Q2N[.211] is 734866. By the way, because Q2N produces integers, Q2N1 merely reproduces the output of Q2N. $\endgroup$
    – bbgodfrey
    Commented Apr 15, 2016 at 22:06
  • $\begingroup$ I agree, but, as you can see in the image, when x=0.2 the y axis is about 2.25 and not an integer. This plot could be a very crazy with several values jumping to strange areas, but not this strange moody curve... $\endgroup$
    – GarouDan
    Commented Apr 15, 2016 at 22:10
  • $\begingroup$ The plot you actually have is Q2N0[x]. Evidently, q is not being passed in Rationalize form. Strange. $\endgroup$
    – bbgodfrey
    Commented Apr 15, 2016 at 22:12

3 Answers 3

4
$\begingroup$

An alternative to bill's plotting approach would be to only evaluate the pairing function at the members of the Farey sequence (similar to the approach in this answer). Thus,

q2N0[q_Rational] := (Numerator[q] + Denominator[q] + 1)
                    (Numerator[q] + Denominator[q])/2 + Denominator[q]

ListPlot[{#, q2N0[#]} & /@ FareySequence[500], PlotStyle -> AbsolutePointSize[1/10]]

Cantor pairing function evaluated at the Farey sequence

$\endgroup$
3
$\begingroup$

FindRoot cannot provide answers to Q2N[x] == 26, because Q2N (and, equivalently, Q2N1) is not a differentiable function. However, a solution clearly exists, which is the whole point of Cantor Pairing. In fact, Solve provides the answer.

Solve[26 == (n + d + 1) (n + d)/2 + d && n > 0 && d > 0, {n, d}, Integers]
(* {{n -> 1, d -> 5}} *)

where n and d are shorthand for Numerator[x] and Denominator[x]. The result is as expected.

More difficult cases are

Q2N[.21]
(* 7481 *)
Solve[7481 == (n + d + 1) (n + d)/2 + d && n > 0 && d > 0, {n, d}, Integers]
(* {{n -> 21, d -> 100}} *)

Q2N[.213]
(* 737291 *)
Solve[737291 == (n + d + 1) (n + d)/2 + d && n > 0 && d > 0, {n, d}, Integers]
(* {{n -> 213, d -> 1000}} *)

Q2N[.2112]
(* 287528 *)
Solve[287528 == (n + d + 1) (n + d)/2 + d && n > 0 && d > 0, {n, d}, Integers]
(* {{n -> 132, d -> 625}} *)

again as expected. (N[132/625] is, indeed, precisely 0.2112.)

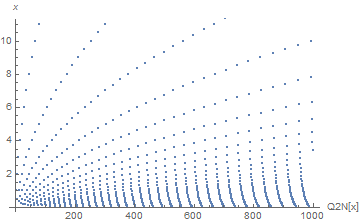
Plot of First 1000 Q2N

For completeness, the solutions for the first 1000 values of Q2N can be plotted.

ListPlot[Table[{i, n/d /. Flatten@Solve[i == (n + d + 1) (n + d)/2 + d && n > 0 && d > 0,
   {n, d}, Integers]}, {i, 1000}], AxesLabel -> {"Q2N[x]", x}]

enter image description here

Note that a solution does not exist for every i, although one does for most i (e.g., 913 of the first 1000).

$\endgroup$
3
  • 4
    $\begingroup$ Talking of values for which no solution exist... a curious sequence appears: Select[Range@100, Resolve[!Exists[{n, d}, n > 0 && d > 0, # == (n + d + 1) (n + d)/2 + d], Integers] &] (* {1, 2, 3, 5, 6, 9, 10, 14, 15, 20, 21, 27, 28, 35, 36, 44, 45, 54, 55, 65, 66, 77, 78, 90, 91} *). It would appear to be OEIS sequence A117142. $\endgroup$
    – kirma
    Commented Apr 16, 2016 at 6:55
  • $\begingroup$ @kirma Interesting. What do you make of it? Thanks. $\endgroup$
    – bbgodfrey
    Commented Apr 16, 2016 at 6:58
  • $\begingroup$ I fear nothing in particular, but it is interesting to see that the sequence is defined in quite different terms in OEIS, and also a lone paper talking of "lexnumbers", whatever they are. $\endgroup$
    – kirma
    Commented Apr 16, 2016 at 7:00
3
$\begingroup$

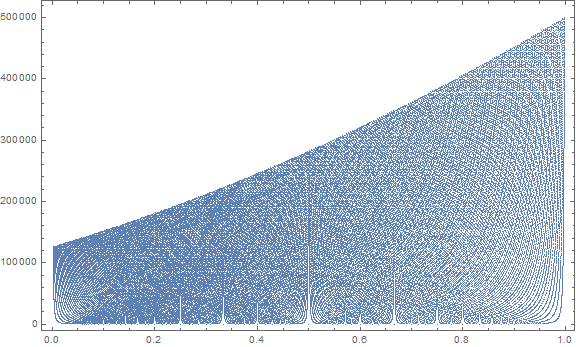
The problem with discontinuity is severe. One approach to understanding this function is to control exactly what values get evaluated (rather than letting this be handled by Plot). For example, here it is for all fractions between $0$ and $1$ with increment of $1/10000$:

q2N0[q_Rational] := (Numerator[q] + Denominator[q] + 1) 
            (Numerator[q] + Denominator[q])/2 + Denominator[q]; 
xvals = Rationalize[Range[0, 1, 0.0001]];
list = q2N0[#] & /@ xvals;
ListPlot[Thread[{xvals, list}]]

Cantor pairing plot

As stated by the OP, the function values are all integers, but they bounce around a lot. I do not think this function is well defined for real numbers, but only for rationals. For example, as I have defined it above, q2N0[2/10] makes sense and is equal to 26 (as you expect) but q2N0[0.2] is undefined. You need to be careful with the domain. You can get another view of the function by plotting using ListLinePlot instead of ListPlot.

$\endgroup$
1
  • $\begingroup$ Very interesting. Nice plot. Using your idea I could get a nice plot (and I think it is OK, as looks like). But FindRoot still breaks... please see my edit. $\endgroup$
    – GarouDan
    Commented Apr 16, 2016 at 2:23

Your Answer

By clicking “Post Your Answer”, you agree to our terms of service and acknowledge you have read our privacy policy.

Not the answer you're looking for? Browse other questions tagged or ask your own question.