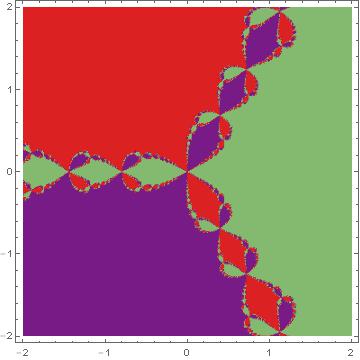
In this question Original Post the user provides a working Mathematica code which plots the basins of attraction using the Newton's iteration method. However the code works only for the function $p(z) = z^3 - 1$.
So my question is what should be changed in the code so as to work with any type of $p(z)$ function (i.e., $p(z) = z^5 -1$, $p(z) = z^2 - 2^z$, etc)?
Many thanks in advance!


f = Function[z, z^3 - 1];$\endgroup$p[z]. $\endgroup$colorList- it assumes three roots. I suggest changing it to something likecolorList = ColorConvert[Hue /@ (Range[numRoots]/numRoots), "RGB"] /. RGBColor[x__] :> cc {x}$\endgroup$p[z_]:=z^5-1$\endgroup$