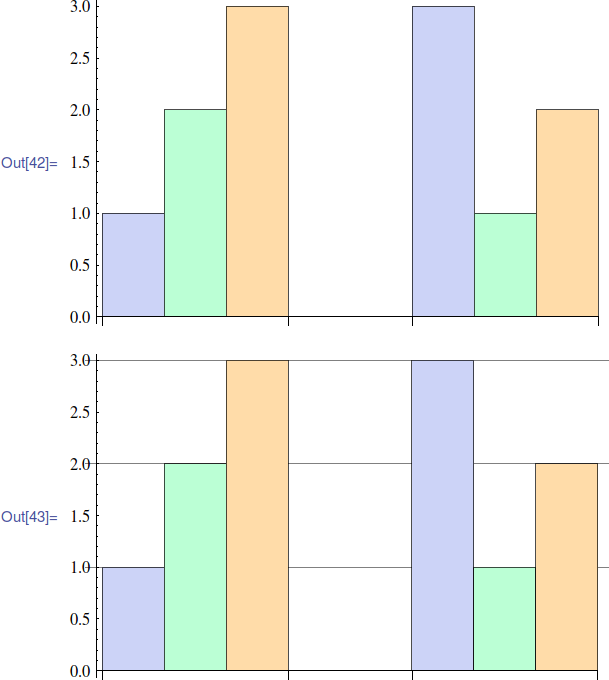
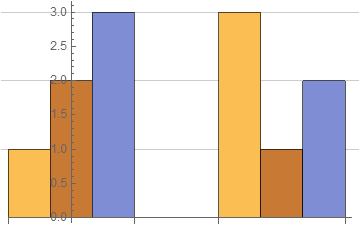
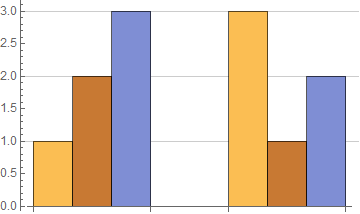
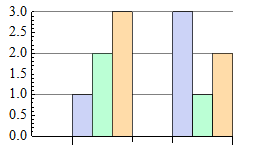
The grid lines in the following plot extend beyond the data and, in particular, into the numbers along the axis.
BarChart[{{1,2,3},{3,1,2}},BarSpacing->{0,2}]
Show[%,GridLines->{None,Range[3]}]

Question
Why does this happen? What can be done to keep the grid lines from going left of the vertical axis?


PlotRangePadding->None. $\endgroup$