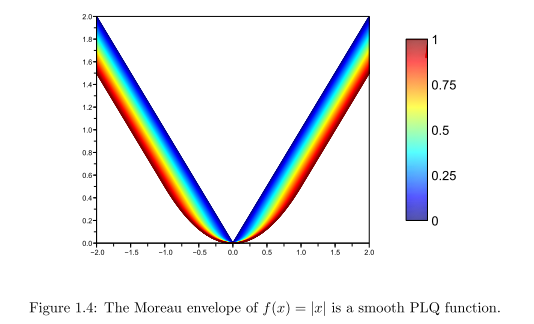
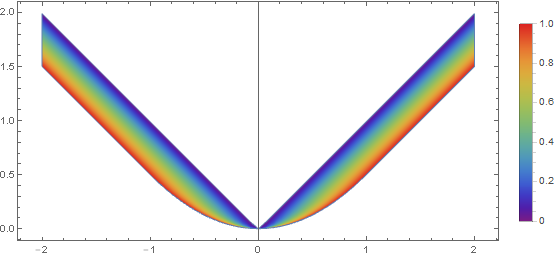
I want to generate a plot similar to this one, which allows for different colors when given different parameters : (This is the Moreau-Yosida regularization of the absolute value)

the Moreau-Yosida regularization is given by :
$$f_{\lambda}(x):= \inf_{u\in \mathbb{R}}\left\lbrace f(u)+ \dfrac{1}{2 \lambda} |x-u|^2 \right\rbrace $$
I want to show these functions in the same plot:
- Absolute value function
- the Moreau-Yosida regularization of the $0-norme$ with different values of $\lambda$ to get this kind of color progression (aesthetically, I think a luminosity progression with a single color would look better than the rainbow colors) ( $|x|_0 = 0$ if $x=0$ and $|x|_0 = 1$ otherwise)
- the Moreau-Yosida regularization of the Absolute value function with different values of $\lambda$ and the same criteria as above.
The following code is my first attempt to set up the visualization I want to get:
Manipulate[
 Plot[{Abs[x],
   1/(2 \[Lambda]) * (Abs[x]^2 - Max[Abs[x]^2 - 2 \[Lambda], 0]),
   1/(2 b) * (Abs[x]^2 - Max[Abs[x] - b, 0]^2)}, {x, -2,
   2}] , {\[Lambda], 1/1000, 1}, {b, 1/1000, 1}]

