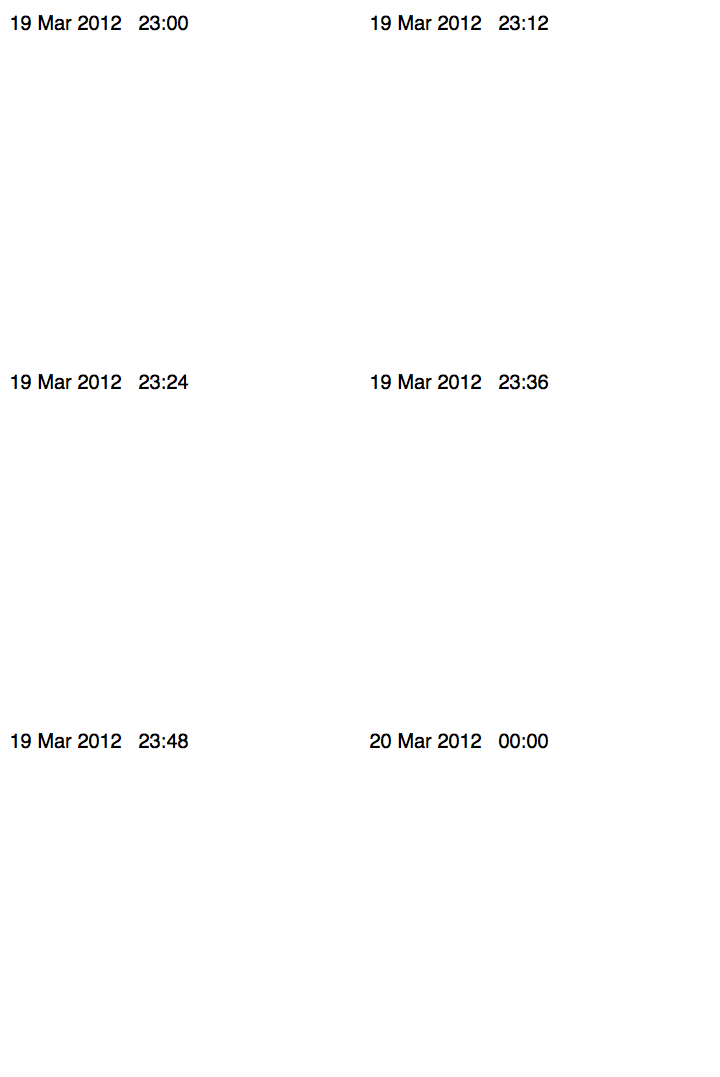
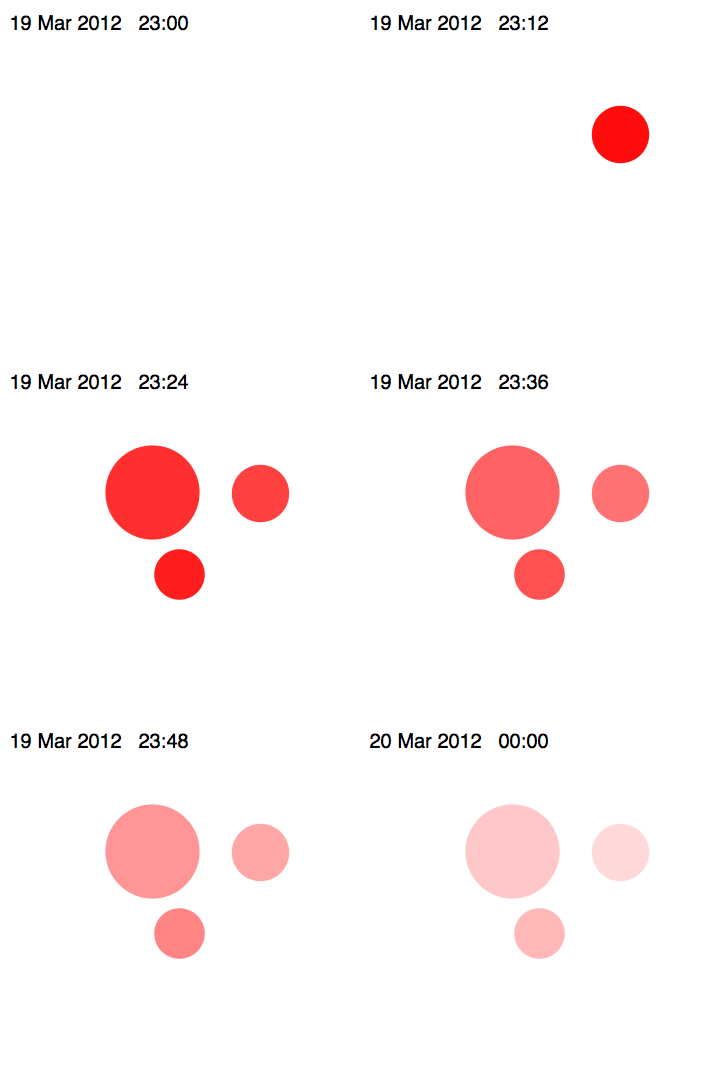
I have a list of events that occurred on specific moments in time. In the example below, the three events occurred at 23:09, 23:13 and 23:17. I was able to build an animation that flows from time 23:00 to 0:00 and shows at the right time the event by plotting a disc of a specified magnitude at the specified coordinates.
data = {{{2012, 3, 19, 23, 9}, 44.891, 12.202, 2.6, 2.5,
   3541187340}, {{2012, 3, 19, 23, 13}, 44.898, 11.258, 6.2, 4.1,
   3541187580}, {{2012, 3, 19, 23, 17}, 44.186, 11.496, 4.2, 2.2,
   3541187820}};
Each event is specified by its time of occurrence, x and y coordinates, magnitude 1, magnitude 2, absolute time. First, I specified the start and end time of the animation in absolute time and build a list of times from start to end in steps of one minute:
start = AbsoluteTime[{2012, 3, 19, 23, 0, 0}];
end = AbsoluteTime[{2012, 3, 20, 0, 0, 0}];
time = Table[start + 60*i, {i, 0, (end - start)/60}];
For my convenience I reshuffled my data:
d3 = Table[{data[[i, 6]], data[[i, 2]], data[[i, 3]], data[[i, 4]],
   data[[i, 5]]}, {i, Length[data]}];
and checked which values in the 'time' list are taken by the time of my events:
doubles =
 Flatten[Table[Position[time, d3[[All, 1]][[i]]], {i, Length[d3]}]];
Lastly, I inserted my events in the 'time' list:
d4 = ReplacePart[time,
   Table[doubles[[i]] -> d3[[i]], {i, Length[d3]}]];
I can then generate my frames:
frames = Animate[If[Length[d4[[i]]] > 1,
  Graphics[{
    White,
    Rectangle[{10, 43}, {13, 46}],
    Red, Disk[d4[[i, {3, 2}]], d4[[i, 5]]/10],
    Black,
    Text[Style[
      DateString[
       DateList[d4[[i, 1]]], {"Day", " ", "MonthNameShort", " ",
        "Year", "   ", "Hour", ":", "Minute"}],
      FontFamily -> "Helvetica", FontSize -> 20], {10.8, 45.85}]
    }],
  Graphics[{
    White,
    Rectangle[{10, 43}, {13, 46}],
    Black,
    Text[Style[
      DateString[
       DateList[d4[[i]]], {"Day", " ", "MonthNameShort", " ", "Year",
        "   ", "Hour", ":", "Minute"}], FontFamily -> "Helvetica",
      FontSize -> 20], {10.8, 45.85}]
    }]
  ], {i, Range[Length[d4]]}, AnimationRate -> 20];

Export["animation.gif", frames, "DisplayDurations" -> .03]

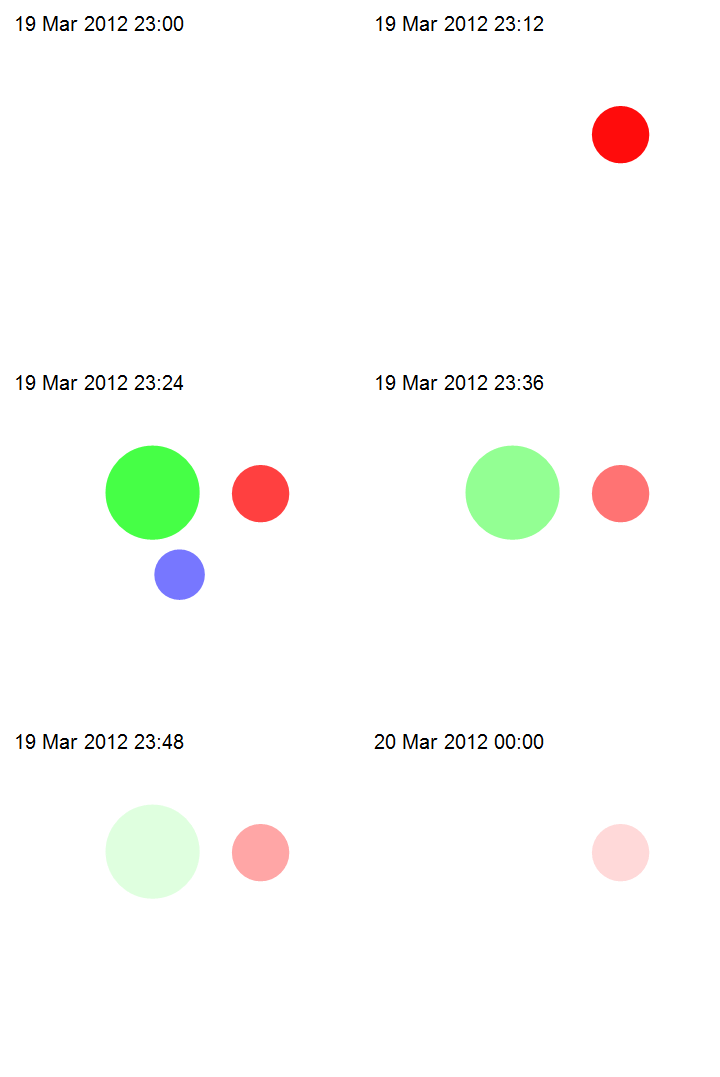
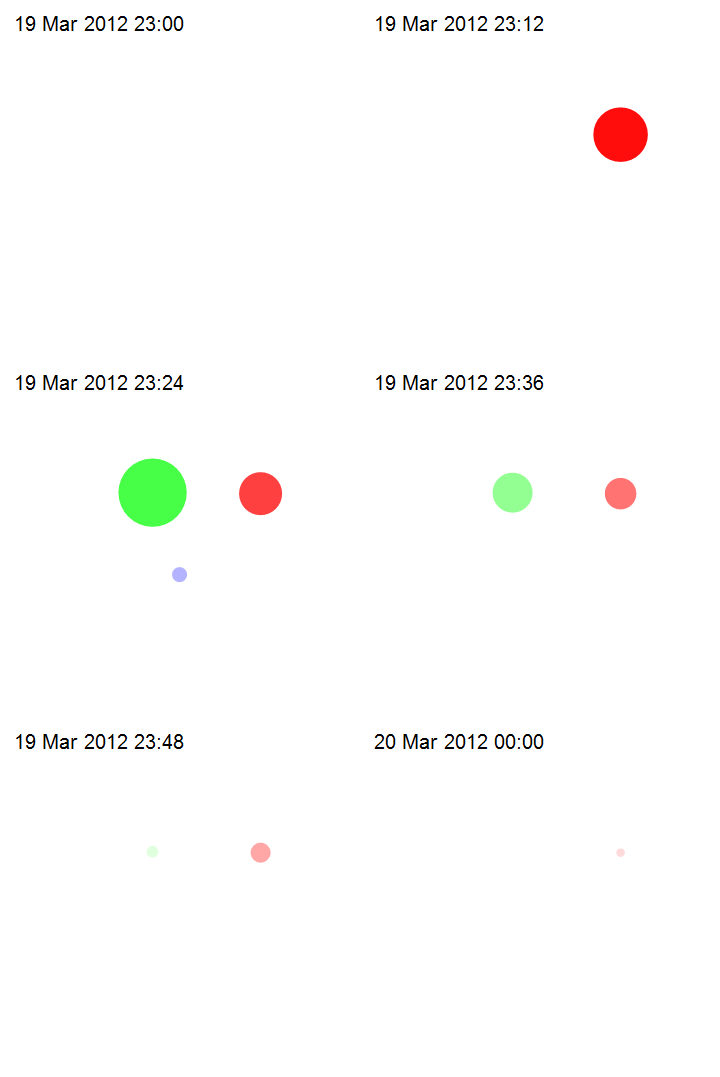
However, what I would like to achieve is a more complicated animation: once an event is plotted at the right time I would like to then present it also on subsequent frames, but slowly dimming (decreasing Opacity) for a specified time window. At the end of the animation all events would be thus dimmed and superimposed.
I simplified a lot the example I provided, real data might span over several days and contain hundreds of events.


