3
$\begingroup$

I am trying to produce plots of a region which can alternately become very long or very tall, and I would like to have some padding around it which is uniformly thick in both the horizontal and vertical directions. However, I'm having some trouble getting the correct settings for PlotRangePadding to achieve this.

More specifically, I'm trying to get a padding between my plot and the surrounding Frame that is (say) 10% of the longest dimension of my plot. This is what I might naïvely expect of a single setting fed to the option, which is meant to produce "the same padding in all directions", but giving it the corresponding setting,

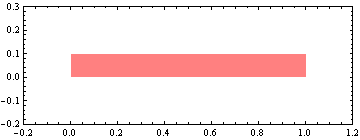
Graphics[{Pink, Rectangle[{0, 0}, {1, 0.1}]}, 
    PlotRangePadding -> Scaled[0.1], Frame -> True]

produces a padding of 10% of the relevant dimension in each direction. This is not very visually pleasing, as the long coordinate has too much padding and the short coordinate has too little padding:

Is there a way to automatically achieve such a scaled uniform padding?

Note that manually setting different settings for the different directions, such as PlotRangePadding -> {Scaled[0.02], Scaled[0.2]} is not an option, as my plots are dynamically generated, and may change from 'long' to 'square' to 'tall'. The coordinate ranges can also change dramatically from the few tenths to the few hundreds in each direction, so a static padding will not work.

$\endgroup$

2 Answers 2

2
$\begingroup$

AbsoluteOptions is not always working well but you can try:

padding[s_, obj_] := With[{
          off = s Max[#2 - # & @@@ (AbsoluteOptions[#, PlotRange][[1, 2]])] &@#
          }, 
          Show[#, PlotRangePadding -> off]] &[obj]

padding[.2, Graphics[{Pink, Rectangle[{0, 0}, {1, 0.1}]}, Frame -> True]]

enter image description here

$\endgroup$
1
$\begingroup$

You could use image metrics to compute the padding.

uniformPad[g_, a_] := 
  With[{pad = a Max[ImageDimensions[Image[g]]]}, 
    Show[g, PlotRangePadding -> pad, Frame -> True]]

g1 = With[{extent = {1, 0.1}}, Graphics[{Pink, Rectangle[{0, 0}, extent]}]];

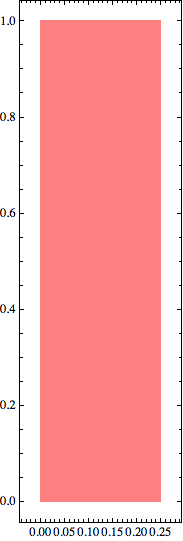
g2 = With[{extent = {0.25, 1}}, Graphics[{Pink, Rectangle[{0, 0}, extent]}]];

uniformPad[g1, .0001]

hbar

uniformPad[g2, .0001]

vbar

$\endgroup$
1
  • $\begingroup$ This does indeed work, but it has the disadvantage that Max[ImageDimensions[Image[g]]] returns the dimensions of the image in points, and the input to PlotRangePadding must be in the units of the image axes. It therefore works for shifting proportions but not for varying sizes: changing extent to even {3,1} produces non-ideal results. $\endgroup$ Commented Feb 18, 2014 at 18:28

Your Answer

By clicking “Post Your Answer”, you agree to our terms of service and acknowledge you have read our privacy policy.

Not the answer you're looking for? Browse other questions tagged or ask your own question.