added 2 characters in body
Source Link

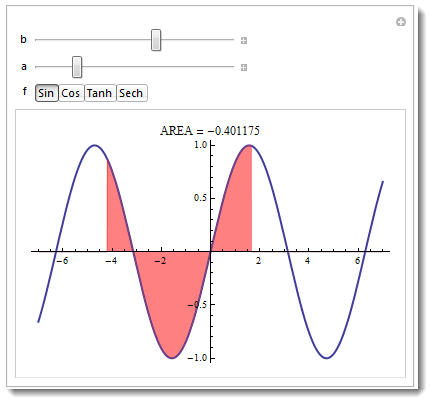
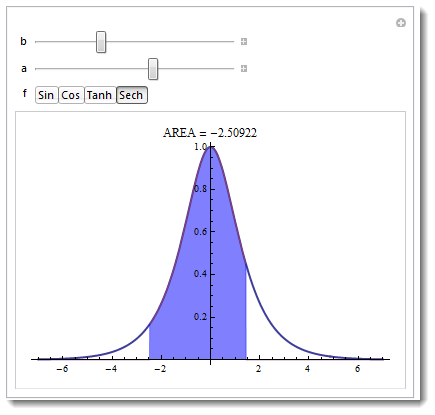
Area will be red or blue depending whether b > a$b > a$ or not.

Manipulate[
  Plot[{f[x], UnitStep[Sign[b - a] (x - a)] UnitStep[Sign[b - a] (b - x)] f[x]}, 
    {x, -7, 7}, PlotStyle -> {Thick, Thickness[0]}, Filling -> {2 -> 0}, 
  FillingStyle -> Directive[Opacity[.5], If[b - a > 0, Red, Blue]], 
  PlotLabel -> "AREA = " <> ToString[NIntegrate[f[x], {x, a, b}]]], {{b, 4}, -7, 7},   
   {{a, -1}, -7, 7}, {f, {Sin, Cos, Tanh, Sech}}]
enter image description here

enter image description here

Also take a look at source code at the Wolfram Demonstration Project.

Area will be red or blue depending whether b > a or not.

Manipulate[
  Plot[{f[x], UnitStep[Sign[b - a] (x - a)] UnitStep[Sign[b - a] (b - x)] f[x]}, 
    {x, -7, 7}, PlotStyle -> {Thick, Thickness[0]}, Filling -> {2 -> 0}, 
  FillingStyle -> Directive[Opacity[.5], If[b - a > 0, Red, Blue]], 
  PlotLabel -> "AREA = " <> ToString[NIntegrate[f[x], {x, a, b}]]], {{b, 4}, -7, 7},   
   {{a, -1}, -7, 7}, {f, {Sin, Cos, Tanh, Sech}}]
enter image description here

enter image description here

Also take a look at source code at the Wolfram Demonstration Project.

Area will be red or blue depending whether $b > a$ or not.

Manipulate[
  Plot[{f[x], UnitStep[Sign[b - a] (x - a)] UnitStep[Sign[b - a] (b - x)] f[x]}, 
    {x, -7, 7}, PlotStyle -> {Thick, Thickness[0]}, Filling -> {2 -> 0}, 
  FillingStyle -> Directive[Opacity[.5], If[b - a > 0, Red, Blue]], 
  PlotLabel -> "AREA = " <> ToString[NIntegrate[f[x], {x, a, b}]]], {{b, 4}, -7, 7},   
   {{a, -1}, -7, 7}, {f, {Sin, Cos, Tanh, Sech}}]

enter image description here

enter image description here

Also take a look at source code at the Wolfram Demonstration Project.
deleted 22 characters in body
Source Link
Vitaliy Kaurov
  • 73.4k
  • 9
  • 206
  • 365

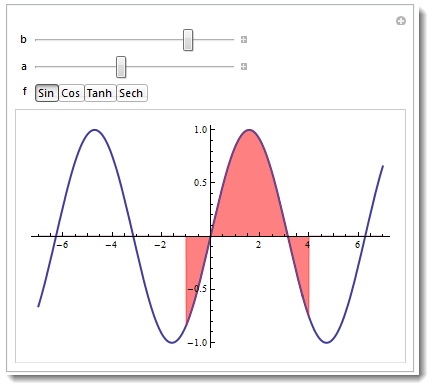
Area will be positive (red)red or negative (blue)blue depending whether b > a or not.

Manipulate[
  Plot[{f[x], UnitStep[Sign[b - a] (x - a)] UnitStep[Sign[b - a] (b - x)] f[x]}, 
    {x, -7, 7}, PlotStyle -> {Thick, Thickness[0]}, Filling -> {2 -> 0}, 
  FillingStyle -> Directive[Opacity[.5], If[b - a > 0, Red, Blue]], 
  PlotLabel -> "AREA = " <> ToString[NIntegrate[f[x], {x, a, b}]]], {{b, 4}, -7, 7},   
   {{a, -1}, -7, 7}, {f, {Sin, Cos, Tanh, Sech}}]

enter image description here

enter image description here

Also take a look at source code at the Wolfram Demonstration Project.
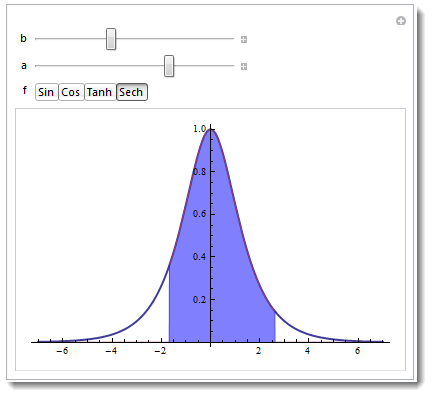
Area will be positive (red) or negative (blue) depending whether b > a or not.

Manipulate[
  Plot[{f[x], UnitStep[Sign[b - a] (x - a)] UnitStep[Sign[b - a] (b - x)] f[x]}, 
    {x, -7, 7}, PlotStyle -> {Thick, Thickness[0]}, Filling -> {2 -> 0}, 
  FillingStyle -> Directive[Opacity[.5], If[b - a > 0, Red, Blue]], 
  PlotLabel -> "AREA = " <> ToString[NIntegrate[f[x], {x, a, b}]]], {{b, 4}, -7, 7},   
   {{a, -1}, -7, 7}, {f, {Sin, Cos, Tanh, Sech}}]

enter image description here

enter image description here

Also take a look at source code at the Wolfram Demonstration Project.

Area will be red or blue depending whether b > a or not.

Manipulate[
  Plot[{f[x], UnitStep[Sign[b - a] (x - a)] UnitStep[Sign[b - a] (b - x)] f[x]}, 
    {x, -7, 7}, PlotStyle -> {Thick, Thickness[0]}, Filling -> {2 -> 0}, 
  FillingStyle -> Directive[Opacity[.5], If[b - a > 0, Red, Blue]], 
  PlotLabel -> "AREA = " <> ToString[NIntegrate[f[x], {x, a, b}]]], {{b, 4}, -7, 7},   
   {{a, -1}, -7, 7}, {f, {Sin, Cos, Tanh, Sech}}]

enter image description here

enter image description here

Also take a look at source code at the Wolfram Demonstration Project.

added 228 characters in body
Source Link
Vitaliy Kaurov
  • 73.4k
  • 9
  • 206
  • 365

Area will be positive (red) or negative (blue) depending whether b > a or not.

Manipulate[Plot[{f[x], Manipulate[
  Plot[{f[x], UnitStep[Sign[b - a] (x - a)] UnitStep[Sign[b - a] (b - x)] f[x]}, 
    {x, -7, 7},  
   PlotStyle -> {Thick, Thickness[0]}, Filling -> {2 -> 0}, 
  FillingStyle -> 
   Directive[Opacity[.5], If[b - a > 0, Red, BlueBlue]], Blue]]]
  PlotLabel -> "AREA = " <> ToString[NIntegrate[f[x], 
 {x, a, b}]]], {{b, 4}, -7, 7},   
   {{a, -1}, -7, 7}, {f, {Sin, Cos, Tanh, Sech}}]

enter image description hereenter image description here

enter image description hereenter image description here

Also take a look at source code at the Wolfram Demonstration Project.

Area will be positive (red) or negative (blue) depending whether b > a or not.

Manipulate[Plot[{f[x], 
   UnitStep[Sign[b - a] (x - a)] UnitStep[Sign[b - a] (b - x)] f[x]}, {x, -7, 7},  
   PlotStyle -> {Thick, Thickness[0]}, Filling -> {2 -> 0}, FillingStyle -> 
   Directive[Opacity[.5], If[b - a > 0, Red, Blue, Blue]]], 
 {{b, 4}, -7, 7}, {{a, -1}, -7, 7}, {f, {Sin, Cos, Tanh, Sech}}

enter image description here

enter image description here

Area will be positive (red) or negative (blue) depending whether b > a or not.

Manipulate[
  Plot[{f[x], UnitStep[Sign[b - a] (x - a)] UnitStep[Sign[b - a] (b - x)] f[x]}, 
    {x, -7, 7}, PlotStyle -> {Thick, Thickness[0]}, Filling -> {2 -> 0}, 
  FillingStyle -> Directive[Opacity[.5], If[b - a > 0, Red, Blue]], 
  PlotLabel -> "AREA = " <> ToString[NIntegrate[f[x], {x, a, b}]]], {{b, 4}, -7, 7},   
   {{a, -1}, -7, 7}, {f, {Sin, Cos, Tanh, Sech}}]

enter image description here

enter image description here

Also take a look at source code at the Wolfram Demonstration Project.

added 322 characters in body
Source Link
Vitaliy Kaurov
  • 73.4k
  • 9
  • 206
  • 365
Loading
Source Link
Vitaliy Kaurov
  • 73.4k
  • 9
  • 206
  • 365
Loading