added 3 characters in body
Source Link
march
  • 24.2k
  • 2
  • 46
  • 102

I was going to do something similar to m_goldberg, but since he has already done that, I'll add a version that uses an Association instead of assigning DownValues, which could be a problem if there are many assignments.

Our sample list:

points = Transpose@{Range[0, 1, 0.1], RandomReal[{0, 1}, 11]}

enter image description here

Then, we define the function g that assigns the values to h, which takes the form of an Association:

Clear[h, g]
h = Association[];
g[x_] := Module[{}
  , AppendTo[h, x -> Association[]]
  ; Scan[
   If[
     0.5 x <= Last@# <= 0.5 (x + 1)
     , AppendTo[h[x], First@# -> 0.5 (x + 1)]
     ] &
   , lst]points]
  ]

Then, for instance if we run g[0.5] and then g[0.3], we get:

enter image description here

h can act as a normal function despite being an Association. That is, let's suppose we're looking at the case where x = 0.5, and we're interested in a couple of values of v. Then

h[0.5, 0.2]
h[0.5, 0.1]
(* 0.75 *)
(* Missing["KeyAbsent", 0.1] *)

If you don't like the Missing behavior, we could always overload the function h in a clever way, or perhaps we could define a new function. We can even plot it:

DiscretePlot[h[0.5, v], {v, 0, 1, 0.1}]

enter image description here

I was going to do something similar to m_goldberg, but since he has already done that, I'll add a version that uses an Association instead of assigning DownValues, which could be a problem if there are many assignments.

Our sample list:

points = Transpose@{Range[0, 1, 0.1], RandomReal[{0, 1}, 11]}

enter image description here

Then, we define the function g that assigns the values to h, which takes the form of an Association:

Clear[h, g]
h = Association[];
g[x_] := Module[{}
  , AppendTo[h, x -> Association[]]
  ; Scan[
   If[
     0.5 x <= Last@# <= 0.5 (x + 1)
     , AppendTo[h[x], First@# -> 0.5 (x + 1)]
     ] &
   , lst]
  ]

Then, for instance if we run g[0.5] and then g[0.3], we get:

enter image description here

h can act as a normal function despite being an Association. That is, let's suppose we're looking at the case where x = 0.5, and we're interested in a couple of values of v. Then

h[0.5, 0.2]
h[0.5, 0.1]
(* 0.75 *)
(* Missing["KeyAbsent", 0.1] *)

If you don't like the Missing behavior, we could always overload the function h in a clever way, or perhaps we could define a new function. We can even plot it:

DiscretePlot[h[0.5, v], {v, 0, 1, 0.1}]

enter image description here

I was going to do something similar to m_goldberg, but since he has already done that, I'll add a version that uses an Association instead of assigning DownValues, which could be a problem if there are many assignments.

Our sample list:

points = Transpose@{Range[0, 1, 0.1], RandomReal[{0, 1}, 11]}

enter image description here

Then, we define the function g that assigns the values to h, which takes the form of an Association:

Clear[h, g]
h = Association[];
g[x_] := Module[{}
  , AppendTo[h, x -> Association[]]
  ; Scan[
   If[
     0.5 x <= Last@# <= 0.5 (x + 1)
     , AppendTo[h[x], First@# -> 0.5 (x + 1)]
     ] &
   , points]
  ]

Then, for instance if we run g[0.5] and then g[0.3], we get:

enter image description here

h can act as a normal function despite being an Association. That is, let's suppose we're looking at the case where x = 0.5, and we're interested in a couple of values of v. Then

h[0.5, 0.2]
h[0.5, 0.1]
(* 0.75 *)
(* Missing["KeyAbsent", 0.1] *)

If you don't like the Missing behavior, we could always overload the function h in a clever way, or perhaps we could define a new function. We can even plot it:

DiscretePlot[h[0.5, v], {v, 0, 1, 0.1}]

enter image description here

added 4 characters in body
Source Link
march
  • 24.2k
  • 2
  • 46
  • 102

I was going to do something similar to m_goldberg, but since he has already done that, I'll add a version that uses an Association instead of assigning DownValues, which could be a problem if there are many assignments.

Our sample list:

points = Transpose@{Range[0, 1, 0.1], RandomReal[{0, 1}, 11]}

enter image description here

enter image description here

Then, we define the function g that assigns the values to h, which takes the form of an Association:

Clear[h, g]
h = Association[];
g[x_] := Module[{}
  , AppendTo[h, x -> Association[]]
  ; Scan[
   If[
     0.5 x <= Last@# <= 0.5 (x + 1)
     , AppendTo[h[x], First@# -> 0.5 (x + 1)]
     ] &
   , lst]
  ]

Then, for instance if we run g[0.5] and then g[0.3], we get:

enter image description here

enter image description here

h can act as a normal function despite being an Association. That is, let's suppose we're looking at the case where x = 0.5, and we're interested in a couple of values of v. Then

h[0.5, 0.2]
h[0.5, 0.1]
(* 0.75 *)
(* Missing["KeyAbsent", 0.1] *)

If you don't like the Missing behavior, we could always overload the function h in a clever way, or perhaps we could define a new function. We can even plot it:

DiscretePlot[h[0.5, v], {v, 0, 1, 0.1}]
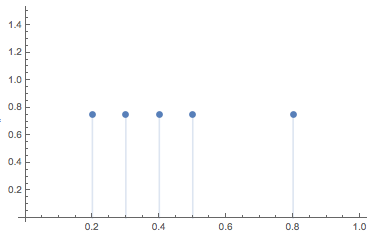
enter image description here

I was going to do something similar to m_goldberg, but since he has already done that, I'll add a version that uses an Association instead of assigning DownValues, which could be a problem if there are many assignments.

Our sample list:

points = Transpose@{Range[0, 1, 0.1], RandomReal[{0, 1}, 11]}

enter image description here

Then, we define the function g that assigns the values to h, which takes the form of an Association:

Clear[h, g]
h = Association[];
g[x_] := Module[{}
  , AppendTo[h, x -> Association[]]
  ; Scan[
   If[
     0.5 x <= Last@# <= 0.5 (x + 1)
     , AppendTo[h[x], First@# -> 0.5 (x + 1)]
     ] &
   , lst]
  ]

Then, for instance if we run g[0.5] and then g[0.3], we get:

enter image description here

h can act as a normal function despite being an Association. That is, let's suppose we're looking at the case where x = 0.5, and we're interested in a couple of values of v. Then

h[0.5, 0.2]
h[0.5, 0.1]
(* 0.75 *)
(* Missing["KeyAbsent", 0.1] *)

If you don't like the Missing behavior, we could always overload the function h in a clever way, or perhaps we could define a new function. We can even plot it:

DiscretePlot[h[0.5, v], {v, 0, 1, 0.1}]

enter image description here

Source Link
march
  • 24.2k
  • 2
  • 46
  • 102

I was going to do something similar to m_goldberg, but since he has already done that, I'll add a version that uses an Association instead of assigning DownValues, which could be a problem if there are many assignments.

Our sample list:

points = Transpose@{Range[0, 1, 0.1], RandomReal[{0, 1}, 11]}

enter image description here

Then, we define the function g that assigns the values to h, which takes the form of an Association:

Clear[h, g]
h = Association[];
g[x_] := Module[{}
  , AppendTo[h, x -> Association[]]
  ; Scan[
   If[
     0.5 x <= Last@# <= 0.5 (x + 1)
     , AppendTo[h[x], First@# -> 0.5 (x + 1)]
     ] &
   , lst]
  ]

Then, for instance if we run g[0.5] and then g[0.3], we get:

enter image description here

h can act as a normal function despite being an Association. That is, let's suppose we're looking at the case where x = 0.5, and we're interested in a couple of values of v. Then

h[0.5, 0.2]
h[0.5, 0.1]
(* 0.75 *)
(* Missing["KeyAbsent", 0.1] *)

If you don't like the Missing behavior, we could always overload the function h in a clever way, or perhaps we could define a new function. We can even plot it:

DiscretePlot[h[0.5, v], {v, 0, 1, 0.1}]

enter image description here