replaced http://mathematica.stackexchange.com/ with https://mathematica.stackexchange.com/
Source Link

I know there are lots of information about this on stack exchange!

Data interpolation and ListContourPlotData interpolation and ListContourPlot

InterpolationOrder for ContourPlotInterpolationOrder for ContourPlot

Unfortunately I was not able to find a proper way to deal with my issue.

I have a Volumetric data which I read from a gaussian Cube file and I can easily Plot it using ListContourPlot3D but the plot is not smooth and I can not use the InterpolationOrder in ListContourPlot3D. I tried interpolating the data and using SmoothKernelDistribution, This only works for a data [x,y] Dimension not [x,y,z]. Even then it's super slow though I only need to plot the data range of [-0.2,0.2] so probably I can cut some data and speed up.

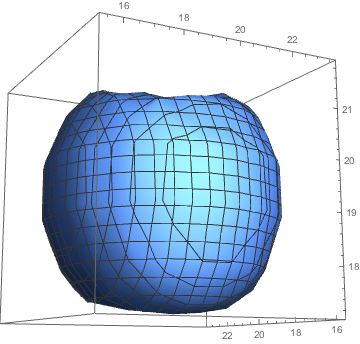
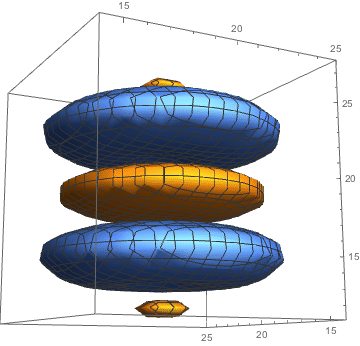
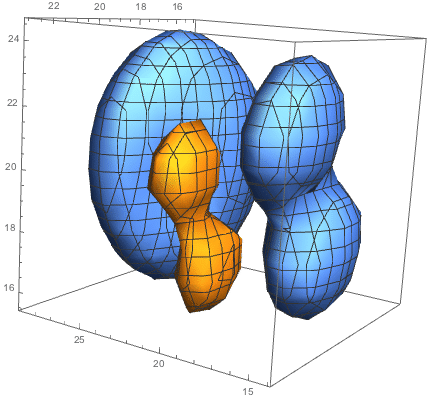
My volumetric data is at dimensions [40,40,40], it can have some mixed volumetric shapes, as below. I have attached it as a wdx file it's the Transpose[cubedata, {3, 2, 1}, so it what would be plotted and can have shapes as below.

enter image description here enter image description here enter image description here

I know there are lots of information about this on stack exchange!

Data interpolation and ListContourPlot

InterpolationOrder for ContourPlot

Unfortunately I was not able to find a proper way to deal with my issue.

I have a Volumetric data which I read from a gaussian Cube file and I can easily Plot it using ListContourPlot3D but the plot is not smooth and I can not use the InterpolationOrder in ListContourPlot3D. I tried interpolating the data and using SmoothKernelDistribution, This only works for a data [x,y] Dimension not [x,y,z]. Even then it's super slow though I only need to plot the data range of [-0.2,0.2] so probably I can cut some data and speed up.

My volumetric data is at dimensions [40,40,40], it can have some mixed volumetric shapes, as below. I have attached it as a wdx file it's the Transpose[cubedata, {3, 2, 1}, so it what would be plotted and can have shapes as below.
enter image description here enter image description here enter image description here

I know there are lots of information about this on stack exchange!

Data interpolation and ListContourPlot

InterpolationOrder for ContourPlot

Unfortunately I was not able to find a proper way to deal with my issue.

I have a Volumetric data which I read from a gaussian Cube file and I can easily Plot it using ListContourPlot3D but the plot is not smooth and I can not use the InterpolationOrder in ListContourPlot3D. I tried interpolating the data and using SmoothKernelDistribution, This only works for a data [x,y] Dimension not [x,y,z]. Even then it's super slow though I only need to plot the data range of [-0.2,0.2] so probably I can cut some data and speed up.

My volumetric data is at dimensions [40,40,40], it can have some mixed volumetric shapes, as below. I have attached it as a wdx file it's the Transpose[cubedata, {3, 2, 1}, so it what would be plotted and can have shapes as below.
enter image description here enter image description here enter image description here

deleted 997 characters in body
Source Link

I know there are lots of information about this on stack exchange!

Data interpolation and ListContourPlot

InterpolationOrder for ContourPlot

Unfortunately I was not able to find a proper way to deal with my issue.

I have a Volumetric data which I read from a gaussian Cube file and I can easily Plot it using ListContourPlot3D but the plot is not smooth and I can not use the InterpolationOrder in ListContourPlot3D. I tried interpolating the data and using SmoothKernelDistribution, This only works for a data [x,y] Dimension not [x,y,z]. Even then it's super slow though I only need to plot the data range of [-0.2,0.2] so probably I can cut some data and speed up.

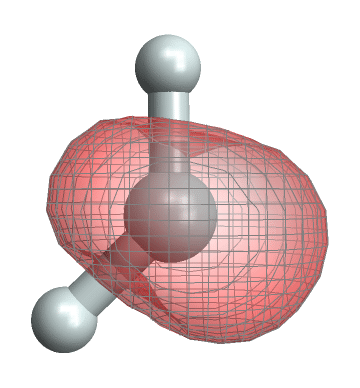
My volumetric data is at dimensions [40,40,40], it can have some mixed volumetric shapes, as below. I have attached it as a wdx file it's the Transpose[cubedata, {3, 2, 1}, so it what would be plotted and can have shapes as below.
enter image description here enter image description here enter image description here

Update

Thanks for a perfect reply,

I hava chosen to go with ArrayResample Because I already had written a function for that. A small issue I'm getting is a scale change after resampling.

I'm using the following commands

molecule = 
  ImportString[xyz, "XYZ", Method -> "SpherePoints", 
   Antialiasing -> True];
Show[molecule, 
 ListContourPlot3D[data, Contours -> {-.02, .02}, 
  ContourStyle -> {{Blue, Opacity[0.4], Antialiasing -> True}, {Red, 
     Opacity[0.4], Antialiasing -> True}}, DataRange -> datarange3D, 
  MeshStyle -> Gray, Lighting -> {{"Ambient", White}}]]

without ArrayResample I get

enter image description here

and with ArrayResample

enter image description here

the data range is as below and I have the wdx file for molecule it's an XYZ file, and of course the volumetric data for this case

{{-486.322, 331.535}, {-370.424, 370.423}, {-330.8, 593.376}}

I know there are lots of information about this on stack exchange!

Data interpolation and ListContourPlot

InterpolationOrder for ContourPlot

Unfortunately I was not able to find a proper way to deal with my issue.

I have a Volumetric data which I read from a gaussian Cube file and I can easily Plot it using ListContourPlot3D but the plot is not smooth and I can not use the InterpolationOrder in ListContourPlot3D. I tried interpolating the data and using SmoothKernelDistribution, This only works for a data [x,y] Dimension not [x,y,z]. Even then it's super slow though I only need to plot the data range of [-0.2,0.2] so probably I can cut some data and speed up.

My volumetric data is at dimensions [40,40,40], it can have some mixed volumetric shapes, as below. I have attached it as a wdx file it's the Transpose[cubedata, {3, 2, 1}, so it what would be plotted and can have shapes as below.
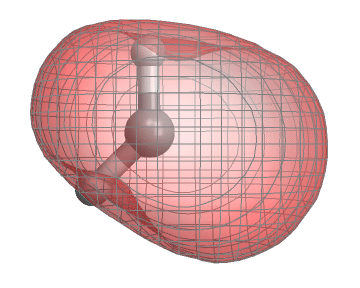
enter image description here enter image description here enter image description here

Update

Thanks for a perfect reply,

I hava chosen to go with ArrayResample Because I already had written a function for that. A small issue I'm getting is a scale change after resampling.

I'm using the following commands

molecule = 
  ImportString[xyz, "XYZ", Method -> "SpherePoints", 
   Antialiasing -> True];
Show[molecule, 
 ListContourPlot3D[data, Contours -> {-.02, .02}, 
  ContourStyle -> {{Blue, Opacity[0.4], Antialiasing -> True}, {Red, 
     Opacity[0.4], Antialiasing -> True}}, DataRange -> datarange3D, 
  MeshStyle -> Gray, Lighting -> {{"Ambient", White}}]]

without ArrayResample I get

enter image description here

and with ArrayResample

enter image description here

the data range is as below and I have the wdx file for molecule it's an XYZ file, and of course the volumetric data for this case

{{-486.322, 331.535}, {-370.424, 370.423}, {-330.8, 593.376}}

I know there are lots of information about this on stack exchange!

Data interpolation and ListContourPlot

InterpolationOrder for ContourPlot

Unfortunately I was not able to find a proper way to deal with my issue.

I have a Volumetric data which I read from a gaussian Cube file and I can easily Plot it using ListContourPlot3D but the plot is not smooth and I can not use the InterpolationOrder in ListContourPlot3D. I tried interpolating the data and using SmoothKernelDistribution, This only works for a data [x,y] Dimension not [x,y,z]. Even then it's super slow though I only need to plot the data range of [-0.2,0.2] so probably I can cut some data and speed up.

My volumetric data is at dimensions [40,40,40], it can have some mixed volumetric shapes, as below. I have attached it as a wdx file it's the Transpose[cubedata, {3, 2, 1}, so it what would be plotted and can have shapes as below.

enter image description here enter image description here enter image description here

added 171 characters in body
Source Link

I know there are lots of information about this on stack exchange!

Data interpolation and ListContourPlot

InterpolationOrder for ContourPlot

Unfortunately I was not able to find a proper way to deal with my issue.

I have a Volumetric data which I read from a gaussian Cube file and I can easily Plot it using ListContourPlot3D but the plot is not smooth and I can not use the InterpolationOrder in ListContourPlot3D. I tried interpolating the data and using SmoothKernelDistribution, This only works for a data [x,y] Dimension not [x,y,z]. Even then it's super slow though I only need to plot the data range of [-0.2,0.2] so probably I can cut some data and speed up.

My volumetric data is at dimensions [40,40,40], it can have some mixed volumetric shapes, as below. I have attached it as a wdx file it's the Transpose[cubedata, {3, 2, 1}, so it what would be plotted and can have shapes as below.

enter image description here enter image description here enter image description here

Update

Thanks for a perfect reply,

I hava chosen to go with ArrayResample Because I already had written a function for that. A small issue I'm getting is a scale change after resampling.

I'm using the following commands

molecule = 
  ImportString[xyz, "XYZ", Method -> "SpherePoints", 
   Antialiasing -> True];
Show[molecule, 
 ListContourPlot3D[data, Contours -> {-.02, .02}, 
  ContourStyle -> {{Blue, Opacity[0.4], Antialiasing -> True}, {Red, 
     Opacity[0.4], Antialiasing -> True}}, DataRange -> datarange3D, 
  MeshStyle -> Gray, Lighting -> {{"Ambient", White}}]]

without ArrayResample I get

enter image description here

and with ArrayResample

enter image description here

the data range is as below and I have the wdx file for molecule it's an XYZ file, and of course the volumetric data for this case

{{-486.322, 331.535}, {-370.424, 370.423}, {-330.8, 593.376}}

I know there are lots of information about this on stack exchange!

Data interpolation and ListContourPlot

InterpolationOrder for ContourPlot

Unfortunately I was not able to find a proper way to deal with my issue.

I have a Volumetric data which I read from a gaussian Cube file and I can easily Plot it using ListContourPlot3D but the plot is not smooth and I can not use the InterpolationOrder in ListContourPlot3D. I tried interpolating the data and using SmoothKernelDistribution, This only works for a data [x,y] Dimension not [x,y,z]. Even then it's super slow though I only need to plot the data range of [-0.2,0.2] so probably I can cut some data and speed up.

My volumetric data is at dimensions [40,40,40], it can have some mixed volumetric shapes, as below. I have attached it as a wdx file it's the Transpose[cubedata, {3, 2, 1}, so it what would be plotted and can have shapes as below.

enter image description here enter image description here enter image description here

Update

Thanks for a perfect reply,

I hava chosen to go with ArrayResample Because I already had written a function for that. A small issue I'm getting is a scale change after resampling.

I'm using the following commands

molecule = 
  ImportString[xyz, "XYZ", Method -> "SpherePoints", 
   Antialiasing -> True];
Show[molecule, 
 ListContourPlot3D[data, Contours -> {-.02, .02}, 
  ContourStyle -> {{Blue, Opacity[0.4], Antialiasing -> True}, {Red, 
     Opacity[0.4], Antialiasing -> True}}, DataRange -> datarange3D, 
  MeshStyle -> Gray, Lighting -> {{"Ambient", White}}]]

without ArrayResample I get

enter image description here

and with ArrayResample

enter image description here

the data range is as below and I have the wdx file for molecule it's an XYZ file

{{-486.322, 331.535}, {-370.424, 370.423}, {-330.8, 593.376}}

I know there are lots of information about this on stack exchange!

Data interpolation and ListContourPlot

InterpolationOrder for ContourPlot

Unfortunately I was not able to find a proper way to deal with my issue.

I have a Volumetric data which I read from a gaussian Cube file and I can easily Plot it using ListContourPlot3D but the plot is not smooth and I can not use the InterpolationOrder in ListContourPlot3D. I tried interpolating the data and using SmoothKernelDistribution, This only works for a data [x,y] Dimension not [x,y,z]. Even then it's super slow though I only need to plot the data range of [-0.2,0.2] so probably I can cut some data and speed up.

My volumetric data is at dimensions [40,40,40], it can have some mixed volumetric shapes, as below. I have attached it as a wdx file it's the Transpose[cubedata, {3, 2, 1}, so it what would be plotted and can have shapes as below.

enter image description here enter image description here enter image description here

Update

Thanks for a perfect reply,

I hava chosen to go with ArrayResample Because I already had written a function for that. A small issue I'm getting is a scale change after resampling.

I'm using the following commands

molecule = 
  ImportString[xyz, "XYZ", Method -> "SpherePoints", 
   Antialiasing -> True];
Show[molecule, 
 ListContourPlot3D[data, Contours -> {-.02, .02}, 
  ContourStyle -> {{Blue, Opacity[0.4], Antialiasing -> True}, {Red, 
     Opacity[0.4], Antialiasing -> True}}, DataRange -> datarange3D, 
  MeshStyle -> Gray, Lighting -> {{"Ambient", White}}]]

without ArrayResample I get

enter image description here

and with ArrayResample

enter image description here

the data range is as below and I have the wdx file for molecule it's an XYZ file, and of course the volumetric data for this case

{{-486.322, 331.535}, {-370.424, 370.423}, {-330.8, 593.376}}
added 1140 characters in body
Source Link
Loading
Source Link
Loading