replaced http://mathematica.stackexchange.com/ with https://mathematica.stackexchange.com/
Source Link

If we can pull the function Rescaled outside of myPlot, as Guess who it isGuess who it is suggests, then it can be done in a fairly straightforward way. (If Rescaled is to depend on the arguments to myPlot, perhaps Rescaled can be written so that any needed parameters can be passed to it through the function call instead coded in its definition. Then the following method could be used.)

ClearAll[Rescaled, myPlot];
Options[Rescaled] = {"CommonZero" -> False};
Rescaled[x_, OptionsPattern[]] := 
  If[TrueQ@OptionValue["CommonZero"],  (*for an common zero line*)
   x - 5,                              (*normal*)
   x];
myPlot[data1_, data2_, opts : OptionsPattern[{ListLinePlot, Rescaled}]] := 
 Module[{dataRescaled},
  dataRescaled = Rescaled[data2, FilterRules[{opts}, Options[Rescaled]]];
  ListLinePlot[{data1, dataRescaled}, 
   FilterRules[{opts}, Options[ListLinePlot]], 
   PlotLegends -> {"should not", "be the legend"}]
  ]

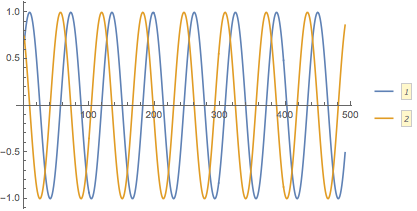
myPlot[Sin[Range[51, 100, .1]], Cos[Range[51, 100, .1]] + 5, 
 PlotLegends -> Automatic, "CommonZero" -> True]
Mathematica graphics

If we can pull the function Rescaled outside of myPlot, as Guess who it is suggests, then it can be done in a fairly straightforward way. (If Rescaled is to depend on the arguments to myPlot, perhaps Rescaled can be written so that any needed parameters can be passed to it through the function call instead coded in its definition. Then the following method could be used.)

ClearAll[Rescaled, myPlot];
Options[Rescaled] = {"CommonZero" -> False};
Rescaled[x_, OptionsPattern[]] := 
  If[TrueQ@OptionValue["CommonZero"],  (*for an common zero line*)
   x - 5,                              (*normal*)
   x];
myPlot[data1_, data2_, opts : OptionsPattern[{ListLinePlot, Rescaled}]] := 
 Module[{dataRescaled},
  dataRescaled = Rescaled[data2, FilterRules[{opts}, Options[Rescaled]]];
  ListLinePlot[{data1, dataRescaled}, 
   FilterRules[{opts}, Options[ListLinePlot]], 
   PlotLegends -> {"should not", "be the legend"}]
  ]

myPlot[Sin[Range[51, 100, .1]], Cos[Range[51, 100, .1]] + 5, 
 PlotLegends -> Automatic, "CommonZero" -> True]

Mathematica graphics

If we can pull the function Rescaled outside of myPlot, as Guess who it is suggests, then it can be done in a fairly straightforward way. (If Rescaled is to depend on the arguments to myPlot, perhaps Rescaled can be written so that any needed parameters can be passed to it through the function call instead coded in its definition. Then the following method could be used.)

ClearAll[Rescaled, myPlot];
Options[Rescaled] = {"CommonZero" -> False};
Rescaled[x_, OptionsPattern[]] := 
  If[TrueQ@OptionValue["CommonZero"],  (*for an common zero line*)
   x - 5,                              (*normal*)
   x];
myPlot[data1_, data2_, opts : OptionsPattern[{ListLinePlot, Rescaled}]] := 
 Module[{dataRescaled},
  dataRescaled = Rescaled[data2, FilterRules[{opts}, Options[Rescaled]]];
  ListLinePlot[{data1, dataRescaled}, 
   FilterRules[{opts}, Options[ListLinePlot]], 
   PlotLegends -> {"should not", "be the legend"}]
  ]

myPlot[Sin[Range[51, 100, .1]], Cos[Range[51, 100, .1]] + 5, 
 PlotLegends -> Automatic, "CommonZero" -> True]

Mathematica graphics

Source Link
Michael E2
  • 244.7k
  • 18
  • 351
  • 774

If we can pull the function Rescaled outside of myPlot, as Guess who it is suggests, then it can be done in a fairly straightforward way. (If Rescaled is to depend on the arguments to myPlot, perhaps Rescaled can be written so that any needed parameters can be passed to it through the function call instead coded in its definition. Then the following method could be used.)

ClearAll[Rescaled, myPlot];
Options[Rescaled] = {"CommonZero" -> False};
Rescaled[x_, OptionsPattern[]] := 
  If[TrueQ@OptionValue["CommonZero"],  (*for an common zero line*)
   x - 5,                              (*normal*)
   x];
myPlot[data1_, data2_, opts : OptionsPattern[{ListLinePlot, Rescaled}]] := 
 Module[{dataRescaled},
  dataRescaled = Rescaled[data2, FilterRules[{opts}, Options[Rescaled]]];
  ListLinePlot[{data1, dataRescaled}, 
   FilterRules[{opts}, Options[ListLinePlot]], 
   PlotLegends -> {"should not", "be the legend"}]
  ]

myPlot[Sin[Range[51, 100, .1]], Cos[Range[51, 100, .1]] + 5, 
 PlotLegends -> Automatic, "CommonZero" -> True]

Mathematica graphics