Commonmark migration
Source Link

#Edit

Edit

#Edit

Edit

Complete clean-up
Source Link
m_goldberg
  • 108.1k
  • 16
  • 104
  • 259

#Edit

In my opinion, what you want to dois asked for is more easily done when the button graphics and the model graphics are kept in separate lists. Also, your code can be simplified.

#Update

I think this code does what the OP is asking for. I have cut away a lot weeds from the OP's original code.

In my opinion, what you want to do is more easily done when the button graphics and the model graphics are kept in separate lists. Also, your code can be simplified.

#Update

I think this code does what the OP is asking for. I have cut away a lot weeds from the OP's original code.

#Edit

In my opinion, what is asked for is more easily done when the button graphics and the model graphics are kept in separate lists.

Complete clean-up
Source Link
m_goldberg
  • 108.1k
  • 16
  • 104
  • 259

In my opinion, what you want to do is more easily done when the button graphics and displayedthe model graphics are kept in separate lists. Also, your code can be simplified.

Here is my take on improving your code. A lot more could be done to improve it, but the following code is reworked enough to accomplish (what I think is) your goal.

Manipulate[
  Column[{
    Row[
      MapThread[
        If[FreeQ[u, #2],
          Button[#1, AppendTo[u, #2]],
          Button[#1, u = DeleteCases[u, #2]]] &, 
        {solar, models}]],
    Row[u]}],
  {u, , None},
  {solar, None},
  {models, None},
  Initialization :> (
     solar = 
       {Graphics3D[{Blue, Sphere[{0, 0, 0}, 0.2]}, Boxed -> False],
        Graphics3D[{Red, Sphere[{0, 0, 0}, 0.2]}, Boxed -> False],
        Graphics3D[{Green, Sphere[{0, 0, 0}, 0.2]}, Boxed -> False],
        Graphics3D[{Orange, Sphere[{0, 0, 0}, 0.2]}, Boxed -> False]};
     models =
       With[{w = 108},
         {Pane[
            SphericalPlot3D[1 + 2 Cos[2 θ], {θ, 0, π}, {ϕ, 0, 2 π}, 
              PlotStyle -> Blue, Mesh -> None, Boxed -> False, Axes -> False],
            ImageSize -> w],
          Pane[
            SphericalPlot3D[Evaluate @ Abs @ SphericalHarmonicY[3, 1, θ, ϕ], 
              {θ, 0, π}, {ϕ, 0, 2 π}, 
              PlotStyle -> Red, Mesh -> None, Boxed -> False, Axes -> False],
            ImageSize -> w],
          Pane[
            ParametricPlot3D[{
              Cos[u] (3 + Cos[u/2] Sin[v] - Sin[u/2] Sin[2 v]), 
              Sin[u] (3 + Cos[u/2] Sin[v] - Sin[u/2] Sin[2 v]), 
              Sin[u/2] Sin[v] + Cos[u/2] Sin[2 v]}, 
              {u, 0, 2 Pi}, {v, 0, 2 Pi}, 
              PlotStyle -> FaceForm[Green, Green], Mesh -> None, 
              Boxed -> False, Axes -> False],
            ImageSize -> w],
          Pane[
            RevolutionPlot3D[{2 + Cos[t], Sin[t]}, {t, 0, 2 Pi}, 
              PlotStyle -> Orange, Mesh -> None, Boxed -> False, 
              Axes -> False],
            ImageSize -> w]}];
     u = models),
  TrackedSymbols :> {u},
  SaveDefinitions -> True]

demo

#Update

I think this code does what the OP is asking for. I have cut away a lot weeds from the OP's original code.

Manipulate[
  Column[{
    Graphics3D[
      MapIndexed[
        If[FreeQ[u, models[[#2[[1]]]]], 
          Button[#[[1]], AppendTo[u, models[[#2[[1]]]]]], 
          Button[#[[1]], u = DeleteCases[u, models[[#2[[1]]]]]]] &, 
        solar],
      ImageSize -> 300, Boxed -> False],
    Graphics3D[u,
      ImageSize -> 300, Boxed -> False]}],
  {{u, {}}, ControlTypeNone},
 -> {solar, None},
  {models, None},
  Initialization :> (
    solar = {
      {Graphics3D[{Blue, Sphere[{0.5, 0., 0.}, 0.2]}, Boxed -> False]], 
       Graphics3D[{Red, Sphere[{1., 0., 0.}, 0.2]}, Boxed -> False]],
       Graphics3D[{Green, Sphere[{1.5, 0., 0.}, 0.2]}, Boxed -> False]], 
       Graphics3D[{Orange, Sphere[{2., 0., 0.}, 0.2]}, Boxed -> False]]};
    models =
     With[{w = 108},
       MapThread[
         Translate[#1[[1]], {#2, 0, 0}] &, 
         {{SphericalPlot3D[1.2 (1 + 2 Cos[2 θ]), {θ, 0, π}, {ϕ, 0, 2 π}, 
             PlotStyle -> Blue, Mesh -> None, Boxed -> FalseNone], 
            SphericalPlot3D[8. AxesAbs ->@ FalseSphericalHarmonicY[3, ImageSize -> w]1,
  θ, ϕ],  
        SphericalPlot3D[8. Abs@SphericalHarmonicY[3, 1, θ, ϕ], {θ, 0, π}, {ϕ, 0, 2 π},
             PlotStyle -> Red, Mesh -> None, Boxed -> False, 
             Axes -> False, ImageSize -> w]None],
           ParametricPlot3D[{
             Cos[u] (3 + Cos[u/2] Sin[v] - Sin[u/2] Sin[2 v]), 
             Sin[u] (3 + Cos[u/2] Sin[v] - Sin[u/2] Sin[2 v]), 
             Sin[u/2] Sin[v] + Cos[u/2] Sin[2 v]}, 
             {u, 0, 2 Pi}, {v, 0, 2 Pi}, 
             PlotStyle -> FaceForm[Green, Green]Green, Mesh -> None, 
             Boxed -> False, Axes -> False, ImageSize -> w]None],
           RevolutionPlot3D[{2 + Cos[t], Sin[t]}, {t, 0, 2 Pi}, 
             PlotStyle -> Orange, Mesh -> None, Boxed -> False, 
             Axes -> False, ImageSize -> w]None]}, 
          10 Range[0, Length[solar] - 1]}]]]),
  SaveDefinitionsTrackedSymbols -:> True]{u}]![demo][2]
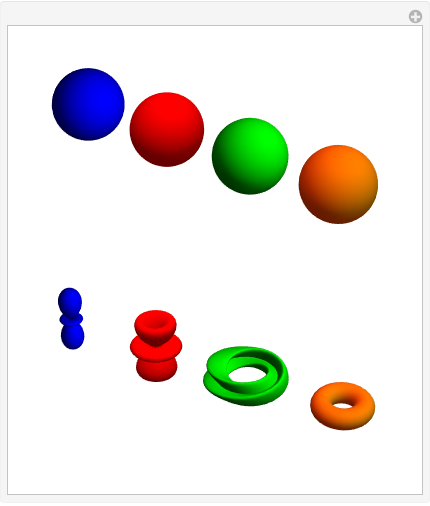
demodemo1

And, yes, you can rotate each row of objects and the top row acts as buttons to show or hide the objects in the bottom row. The codeHere is a bit rough in places, but I don't have time now to clean it uprotated view.
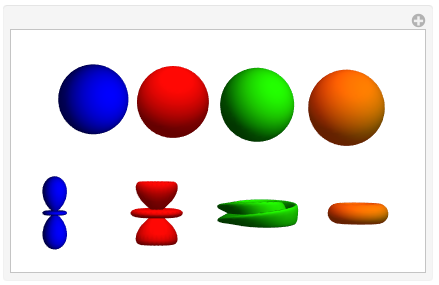
demo2

In my opinion, what you want to do is more easily done when the button graphics and displayed graphics are kept in separate lists. Also, your code can be simplified.

Here is my take on improving your code. A lot more could be done to improve it, but the following code is reworked enough to accomplish (what I think is) your goal.

Manipulate[
  Column[{
    Row[
      MapThread[
        If[FreeQ[u, #2],
          Button[#1, AppendTo[u, #2]],
          Button[#1, u = DeleteCases[u, #2]]] &, 
        {solar, models}]],
    Row[u]}],
  {u, , None},
  {solar, None},
  {models, None},
  Initialization :> (
     solar = 
       {Graphics3D[{Blue, Sphere[{0, 0, 0}, 0.2]}, Boxed -> False],
        Graphics3D[{Red, Sphere[{0, 0, 0}, 0.2]}, Boxed -> False],
        Graphics3D[{Green, Sphere[{0, 0, 0}, 0.2]}, Boxed -> False],
        Graphics3D[{Orange, Sphere[{0, 0, 0}, 0.2]}, Boxed -> False]};
     models =
       With[{w = 108},
         {Pane[
            SphericalPlot3D[1 + 2 Cos[2 θ], {θ, 0, π}, {ϕ, 0, 2 π}, 
              PlotStyle -> Blue, Mesh -> None, Boxed -> False, Axes -> False],
            ImageSize -> w],
          Pane[
            SphericalPlot3D[Evaluate @ Abs @ SphericalHarmonicY[3, 1, θ, ϕ], 
              {θ, 0, π}, {ϕ, 0, 2 π}, 
              PlotStyle -> Red, Mesh -> None, Boxed -> False, Axes -> False],
            ImageSize -> w],
          Pane[
            ParametricPlot3D[{
              Cos[u] (3 + Cos[u/2] Sin[v] - Sin[u/2] Sin[2 v]), 
              Sin[u] (3 + Cos[u/2] Sin[v] - Sin[u/2] Sin[2 v]), 
              Sin[u/2] Sin[v] + Cos[u/2] Sin[2 v]}, 
              {u, 0, 2 Pi}, {v, 0, 2 Pi}, 
              PlotStyle -> FaceForm[Green, Green], Mesh -> None, 
              Boxed -> False, Axes -> False],
            ImageSize -> w],
          Pane[
            RevolutionPlot3D[{2 + Cos[t], Sin[t]}, {t, 0, 2 Pi}, 
              PlotStyle -> Orange, Mesh -> None, Boxed -> False, 
              Axes -> False],
            ImageSize -> w]}];
     u = models),
  TrackedSymbols :> {u},
  SaveDefinitions -> True]

demo

#Update

I think this code does what the OP is asking for.

Manipulate[
  Column[{
    Graphics3D[
      MapIndexed[
        If[FreeQ[u, models[[#2[[1]]]]], 
          Button[#[[1]], AppendTo[u, models[[#2[[1]]]]]], 
          Button[#[[1]], u = DeleteCases[u, models[[#2[[1]]]]]]] &, 
        solar],
      ImageSize -> 300, Boxed -> False],
    Graphics3D[u,
      ImageSize -> 300, Boxed -> False]}],
  {{u, {}}, ControlType -> None},
  Initialization :> (
    solar = {
      Graphics3D[{Blue, Sphere[{0.5, 0., 0.}, 0.2]}, Boxed -> False], 
      Graphics3D[{Red, Sphere[{1., 0., 0.}, 0.2]}, Boxed -> False],
      Graphics3D[{Green, Sphere[{1.5, 0., 0.}, 0.2]}, Boxed -> False], 
      Graphics3D[{Orange, Sphere[{2., 0., 0.}, 0.2]}, Boxed -> False]};
    models =
     With[{w = 108},
       MapThread[
         Translate[#1[[1]], {#2, 0, 0}] &, 
         {{SphericalPlot3D[1.2 (1 + 2 Cos[2 θ]), {θ, 0, π}, {ϕ, 0, 2 π}, 
             PlotStyle -> Blue, Mesh -> None, Boxed -> False, 
             Axes -> False, ImageSize -> w],
            SphericalPlot3D[8. Abs@SphericalHarmonicY[3, 1, θ, ϕ], {θ, 0, π}, {ϕ, 0, 2 π},
             PlotStyle -> Red, Mesh -> None, Boxed -> False, 
             Axes -> False, ImageSize -> w],
           ParametricPlot3D[{
             Cos[u] (3 + Cos[u/2] Sin[v] - Sin[u/2] Sin[2 v]), 
             Sin[u] (3 + Cos[u/2] Sin[v] - Sin[u/2] Sin[2 v]), 
             Sin[u/2] Sin[v] + Cos[u/2] Sin[2 v]}, 
             {u, 0, 2 Pi}, {v, 0, 2 Pi}, 
             PlotStyle -> FaceForm[Green, Green], Mesh -> None, 
             Boxed -> False, Axes -> False, ImageSize -> w],
           RevolutionPlot3D[{2 + Cos[t], Sin[t]}, {t, 0, 2 Pi}, 
             PlotStyle -> Orange, Mesh -> None, Boxed -> False, 
             Axes -> False, ImageSize -> w]}, 
          10 Range[0, Length[solar] - 1]}]]),
  SaveDefinitions -> True]

demo

And, yes, you can rotate each row of objects and the top row acts as buttons to show or hide the objects in the bottom row. The code is a bit rough in places, but I don't have time now to clean it up.

In my opinion, what you want to do is more easily done when the button graphics and the model graphics are kept in separate lists. Also, your code can be simplified.

#Update

I think this code does what the OP is asking for. I have cut away a lot weeds from the OP's original code.

Manipulate[
  Column[{
    Graphics3D[
      MapIndexed[
        If[FreeQ[u, models[[#2[[1]]]]], 
          Button[#[[1]], AppendTo[u, models[[#2[[1]]]]]], 
          Button[#[[1]], u = DeleteCases[u, models[[#2[[1]]]]]]] &, 
        solar],
      ImageSize -> 300, Boxed -> False],
    Graphics3D[u,
      ImageSize -> 300, Boxed -> False]}],
  {{u, {}}, None},
  {solar, None},
  {models, None},
  Initialization :> (
    solar = 
      {Graphics3D[{Blue, Sphere[{0.5, 0., 0.}, 0.2]}], 
       Graphics3D[{Red, Sphere[{1., 0., 0.}, 0.2]}],
       Graphics3D[{Green, Sphere[{1.5, 0., 0.}, 0.2]}], 
       Graphics3D[{Orange, Sphere[{2., 0., 0.}, 0.2]}]};
    models =
      MapThread[
        Translate[#1[[1]], {#2, 0, 0}] &, 
        {{SphericalPlot3D[1.2 (1 + 2 Cos[2 θ]), {θ, 0, π}, {ϕ, 0, 2 π}, 
            PlotStyle -> Blue, Mesh -> None],
          SphericalPlot3D[8. Abs @ SphericalHarmonicY[3, 1, θ, ϕ],  
            {θ, 0, π}, {ϕ, 0, 2 π},
            PlotStyle -> Red, Mesh -> None],
          ParametricPlot3D[{
            Cos[u] (3 + Cos[u/2] Sin[v] - Sin[u/2] Sin[2 v]), 
            Sin[u] (3 + Cos[u/2] Sin[v] - Sin[u/2] Sin[2 v]), 
            Sin[u/2] Sin[v] + Cos[u/2] Sin[2 v]}, 
            {u, 0, 2 Pi}, {v, 0, 2 Pi}, 
            PlotStyle -> Green, Mesh -> None],
          RevolutionPlot3D[{2 + Cos[t], Sin[t]}, {t, 0, 2 Pi}, 
            PlotStyle -> Orange, Mesh -> None]}, 
         10 Range[0, Length[solar] - 1]}]),
  TrackedSymbols :> {u}]![demo][2]

demo1

And, yes, you can rotate each row of objects and the top row acts as buttons to show or hide the objects in the bottom row. Here is a rotated view.

demo2

improved readability
Source Link
m_goldberg
  • 108.1k
  • 16
  • 104
  • 259
Loading
New solution that achieves the OP's goals
Source Link
m_goldberg
  • 108.1k
  • 16
  • 104
  • 259
Loading
Source Link
m_goldberg
  • 108.1k
  • 16
  • 104
  • 259
Loading