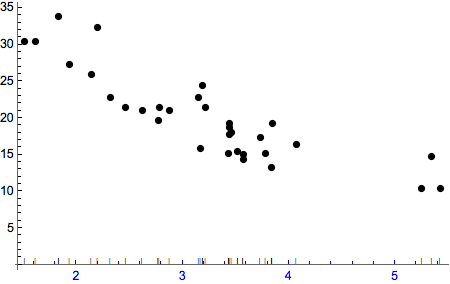
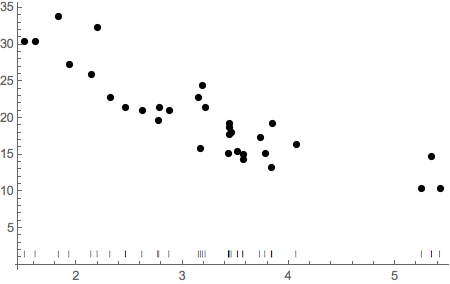
Here is a possible implementation of rug representation using ListPlot. Maybe implementation from @MarcoB is more efficient.
jitter function
Here is a implementation of jitter function:
jitter[x_] := Module[{r, z, xx, d}, r = {Min[x], Max[x]};
  z = First@Differences[r];
  z = If[z == 0, Abs[r], z];
  z = If[z == 0, 1, z];
  xx = DeleteDuplicates@Sort@Round[x, 10^(-3 + Floor@Log10[z])];
  d = Differences[xx];
  d = If[Length@d > 0, Min@d, If[xx != 0, xx/10, z/10]];
  x + RandomReal[{-Abs[d]/5, Abs[d]/5}, Length@x]
  ]
Based on this, rug plot can be implemented as
ListPlot[{Thread@{x, y}, Tuples@{jitter@x, {01.5}}},
 PlotMarkers -> {{}, {"|", 6}}, PlotStyle -> Black,
 TicksStyle -> {Blue, Black}]Black]


Density plot vs. rug
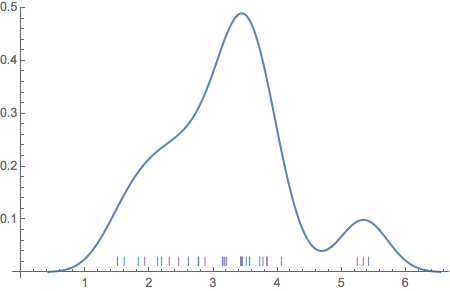
@Jens thinks density plot is more informative. I agree with the idea that density plot are easy to read, but rug provides more details of the data than density estimation. Most of the time, this is a bad thing, because we do not want to represent to much information in one graph. However, I think there are cases, rug is more suitable. Following is density estimation and is rug representation of wt in mtcars dataset. I think it is not so bad to have a rug representation near the axes.
Show[{SmoothHistogram[x],
  ListPlot[Tuples@{jitter@x, {0.02}}, PlotMarkers -> {"|", 8}]}]

