Added explanatory matter
Source Link
m_goldberg
  • 108.1k
  • 16
  • 104
  • 259

It can be done with Epilog and Inset. One must take care about the coordinates of the arrow, the text, and the inset box.

Plot[Sin[2 Pi x], {x, 0, 3},
  PlotRange -> All,
  PlotRangePadding -> {Automatic, {Automatic, .2}},
  Epilog -> 
    Inset[Graphics[{
      Arrowheads[{-0.07, 0.07}],
      Arrow[{{.250, 0}, {1.25, 0}}], 
      Text[Style[" Period ", Background -> White], {.755, 0}]}],
    {.75, 1.05}]]
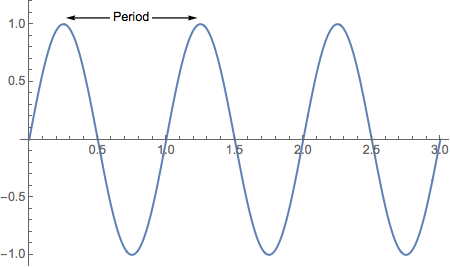
plot

Note that the end points of the arrow are placed at x = 0 and x = 1 and the text is centered at x = .5, the mid-point of arrow. These coordinates are local to the inset box. Then the inset box is centered at plot coordinates x = .75 and y = 1.05 to position the annotation properly in plot.

It can be done with Epilog and Inset. One must take care about the coordinates of the arrow, the text, and the inset box.

Plot[Sin[2 Pi x], {x, 0, 3},
  PlotRange -> All,
  PlotRangePadding -> {Automatic, {Automatic, .2}},
  Epilog -> 
    Inset[Graphics[{
      Arrowheads[{-0.07, 0.07}],
      Arrow[{{.25, 0}, {1.25, 0}}], 
      Text[Style[" Period ", Background -> White], {.75, 0}]}],
    {.75, 1.05}]]

plot

It can be done with Epilog and Inset. One must take care about the coordinates of the arrow, the text, and the inset box.

Plot[Sin[2 Pi x], {x, 0, 3},
  PlotRange -> All,
  PlotRangePadding -> {Automatic, {Automatic, .2}},
  Epilog -> 
    Inset[Graphics[{
      Arrowheads[{-0.07, 0.07}],
      Arrow[{{0, 0}, {1, 0}}], 
      Text[Style[" Period ", Background -> White], {.5, 0}]}],
    {.75, 1.05}]]

plot

Note that the end points of the arrow are placed at x = 0 and x = 1 and the text is centered at x = .5, the mid-point of arrow. These coordinates are local to the inset box. Then the inset box is centered at plot coordinates x = .75 and y = 1.05 to position the annotation properly in plot.

added 129 characters in body
Source Link
m_goldberg
  • 108.1k
  • 16
  • 104
  • 259

It can be done with Epilog and Inset. One must take care about the coordinates of the arrow, the text, and the inset box.

Plot[Sin[2 Pi x], {x, 0, 3},
  PlotRange -> All,
  PlotRangePadding -> {Automatic, {Automatic, .2}},
  Epilog -> 
    Inset[Graphics[{
      Arrowheads[{-0.07, 0.07}],
      Arrow[{{.25, 0}, {1.25, 0}}], 
      Text[Style[" Period ", Background -> White], {.75, 0}]}],
    {.75, 1.05}]]

plot

Plot[Sin[2 Pi x], {x, 0, 3},
  PlotRange -> All,
  PlotRangePadding -> {Automatic, {Automatic, .2}},
  Epilog -> 
    Inset[Graphics[{
      Arrowheads[{-0.07, 0.07}],
      Arrow[{{.25, 0}, {1.25, 0}}], 
      Text[Style[" Period ", Background -> White], {.75, 0}]}],
    {.75, 1.05}]]

plot

It can be done with Epilog and Inset. One must take care about the coordinates of the arrow, the text, and the inset box.

Plot[Sin[2 Pi x], {x, 0, 3},
  PlotRange -> All,
  PlotRangePadding -> {Automatic, {Automatic, .2}},
  Epilog -> 
    Inset[Graphics[{
      Arrowheads[{-0.07, 0.07}],
      Arrow[{{.25, 0}, {1.25, 0}}], 
      Text[Style[" Period ", Background -> White], {.75, 0}]}],
    {.75, 1.05}]]

plot

Source Link
m_goldberg
  • 108.1k
  • 16
  • 104
  • 259

Plot[Sin[2 Pi x], {x, 0, 3},
  PlotRange -> All,
  PlotRangePadding -> {Automatic, {Automatic, .2}},
  Epilog -> 
    Inset[Graphics[{
      Arrowheads[{-0.07, 0.07}],
      Arrow[{{.25, 0}, {1.25, 0}}], 
      Text[Style[" Period ", Background -> White], {.75, 0}]}],
    {.75, 1.05}]]

plot