added 6 characters in body
Source Link
Mr.Wizard
  • 273.1k
  • 34
  • 595
  • 1.4k

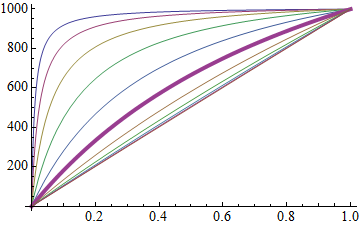
I prefer using Style in cases like this.

rp[x_, r_] := 1000 x (r + 1)/(r + x)

ratios = Table[10^n, {n, -2, 2, 4/10}];

em = Style[#, AbsoluteThickness[4]] &;

Plot[
 MapAt[em, rp[x, #] & /@ ratios, 6],
 {x, 0, 1},
 Evaluated -> True
]
Mathematica graphics

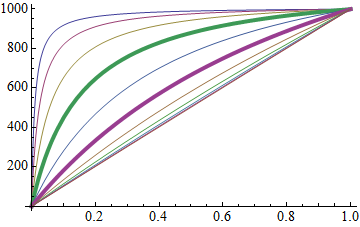
Plot[
 MapAt[em, rp[x, #] & /@ ratios, {{4}, {6}}],
 {x, 0, 1},
 Evaluated -> True
]
Mathematica graphics


This works for styling directives except for color (by default), but colors are overridden by the default PlotStyle colors because of the output form, which is:

Style[{(* PlotStyle directive *), Line[. . .]}, (* Style directive *)]

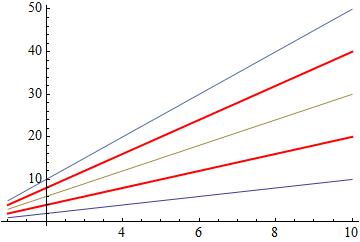
If for whatever reason the Style method is desirable even for colors as well one could use:

red = Style[#, Red, Thick] &;

Plot[
  MapAt[red, x Range@5, {{2}, {4}}],
  {x, 1, 10},
  Evaluated -> True
] /. Style[{__, L__Line}, s__] :> Style[{L}, s]
Mathematica graphics

This discards all PlotStyle directives and keeps the Style directives for lines with Style.

I prefer using Style in cases like this.

rp[x_, r_] := 1000 x (r + 1)/(r + x)

ratios = Table[10^n, {n, -2, 2, 4/10}];

em = Style[#, AbsoluteThickness[4]] &;

Plot[
 MapAt[em, rp[x, #] & /@ ratios, 6],
 {x, 0, 1},
 Evaluated -> True
]

Mathematica graphics

Plot[
 MapAt[em, rp[x, #] & /@ ratios, {{4}, {6}}],
 {x, 0, 1},
 Evaluated -> True
]

Mathematica graphics


This works for styling directives except for color (by default), but colors are overridden by the default PlotStyle colors because of the output form, which is:

Style[{(* PlotStyle directive *), Line[. . .]}, (* Style directive *)]

If for whatever reason the Style method desirable even for colors one could use:

red = Style[#, Red, Thick] &;

Plot[
  MapAt[red, x Range@5, {{2}, {4}}],
  {x, 1, 10},
  Evaluated -> True
] /. Style[{__, L__Line}, s__] :> Style[{L}, s]

Mathematica graphics

This discards all PlotStyle directives and keeps the Style directives for lines with Style.

I prefer using Style in cases like this.

rp[x_, r_] := 1000 x (r + 1)/(r + x)

ratios = Table[10^n, {n, -2, 2, 4/10}];

em = Style[#, AbsoluteThickness[4]] &;

Plot[
 MapAt[em, rp[x, #] & /@ ratios, 6],
 {x, 0, 1},
 Evaluated -> True
]

Mathematica graphics

Plot[
 MapAt[em, rp[x, #] & /@ ratios, {{4}, {6}}],
 {x, 0, 1},
 Evaluated -> True
]

Mathematica graphics


This works for styling directives except for color (by default), but colors are overridden by the default PlotStyle colors because of the output form, which is:

Style[{(* PlotStyle directive *), Line[. . .]}, (* Style directive *)]

If for whatever reason the Style method is desirable for colors as well one could use:

red = Style[#, Red, Thick] &;

Plot[
  MapAt[red, x Range@5, {{2}, {4}}],
  {x, 1, 10},
  Evaluated -> True
] /. Style[{__, L__Line}, s__] :> Style[{L}, s]

Mathematica graphics

This discards all PlotStyle directives and keeps the Style directives for lines with Style.

added 678 characters in body; added 23 characters in body; added 4 characters in body
Source Link
Mr.Wizard
  • 273.1k
  • 34
  • 595
  • 1.4k

I prefer using Style in cases like this.

rp[x_, r_] := 1000 x (r + 1)/(r + x)

ratios = Table[10^n, {n, -2, 2, 4/10}];

em = Style[#, AbsoluteThickness[4]] &;

Plot[
 MapAt[em, rp[x, #] & /@ ratios, 6],
 {x, 0, 1},
 Evaluated -> True
]

Mathematica graphics

Plot[
 MapAt[em, rp[x, #] & /@ ratios, {{4}, {6}}],
 {x, 0, 1},
 Evaluated -> True
]

Mathematica graphics


This works for styling directives except for color (by default), but colors are overridden by the default PlotStyle colors because of the output form, which is:

Style[{(* PlotStyle directive *), Line[. . .]}, (* Style directive *)]

If for whatever reason the Style method desirable even for colors one could use:

red = Style[#, Red, Thick] &;

Plot[
  MapAt[red, x Range@5, {{2}, {4}}],
  {x, 1, 10},
  Evaluated -> True
] /. Style[{__, L__Line}, s__] :> Style[{L}, s]

Mathematica graphics

This discards all PlotStyle directives and keeps the Style directives for lines with Style.

I prefer using Style in cases like this.

rp[x_, r_] := 1000 x (r + 1)/(r + x)

ratios = Table[10^n, {n, -2, 2, 4/10}];

em = Style[#, AbsoluteThickness[4]] &;

Plot[
 MapAt[em, rp[x, #] & /@ ratios, 6],
 {x, 0, 1},
 Evaluated -> True
]

Mathematica graphics

Plot[
 MapAt[em, rp[x, #] & /@ ratios, {{4}, {6}}],
 {x, 0, 1},
 Evaluated -> True
]

Mathematica graphics


This works for styling directives except for color (by default), but colors are overridden by the default PlotStyle colors because of the output form, which is:

Style[{(* PlotStyle directive *), Line[. . .]}, (* Style directive *)]

If for whatever reason the Style method desirable even for colors one could use:

red = Style[#, Red, Thick] &;

Plot[
  MapAt[red, x Range@5, {{2}, {4}}],
  {x, 1, 10},
  Evaluated -> True
] /. Style[{__, L__Line}, s__] :> Style[{L}, s]

Mathematica graphics

This discards all PlotStyle directives and keeps the Style directives for lines with Style.

deleted 3 characters in body
Source Link
Mr.Wizard
  • 273.1k
  • 34
  • 595
  • 1.4k

I prefer using Style in cases like this.

rp[x_, r_] := 1000 x (r + 1)/(r + x)

ratios = Table[10^n, {n, -2, 2, 4/10}];

em = Style[#, AbsoluteThickness[4]] &;

Plot[
 MapAt[em, rp[x, #] & /@ ratios, 6],
 {x, 0, 1},
 Evaluated -> True
]

Mathematica graphics

Plot[
 MapAt[styleMapAt[em, rp[x, #] & /@ ratios, {{4}, {6}}],
 {x, 0, 1},
 Evaluated -> True
]

Mathematica graphics

I prefer using Style in cases like this.

rp[x_, r_] := 1000 x (r + 1)/(r + x)

ratios = Table[10^n, {n, -2, 2, 4/10}];

em = Style[#, AbsoluteThickness[4]] &;

Plot[
 MapAt[em, rp[x, #] & /@ ratios, 6],
 {x, 0, 1},
 Evaluated -> True
]

Mathematica graphics

Plot[
 MapAt[style, rp[x, #] & /@ ratios, {{4}, {6}}],
 {x, 0, 1},
 Evaluated -> True
]

Mathematica graphics

I prefer using Style in cases like this.

rp[x_, r_] := 1000 x (r + 1)/(r + x)

ratios = Table[10^n, {n, -2, 2, 4/10}];

em = Style[#, AbsoluteThickness[4]] &;

Plot[
 MapAt[em, rp[x, #] & /@ ratios, 6],
 {x, 0, 1},
 Evaluated -> True
]

Mathematica graphics

Plot[
 MapAt[em, rp[x, #] & /@ ratios, {{4}, {6}}],
 {x, 0, 1},
 Evaluated -> True
]

Mathematica graphics

Source Link
Mr.Wizard
  • 273.1k
  • 34
  • 595
  • 1.4k
Loading