added 60 characters in body
Source Link
kglr
  • 400.5k
  • 18
  • 488
  • 929
Plot[40000. fakedata Sin[x],= Transpose[{xRange[500], -3 PiRandomReal[4000, 3 Pi{500}]}];
ListLinePlot[fakedata, 
 Ticks -> {{-Pi, 0, Pi}Automatic, 
           {#, ScientificForm@#} & /@ {-40000 Range[0., 400004000., 100001000.]}, 
 PlotRange -> {0, 4500}]
enter image description hereenter image description here

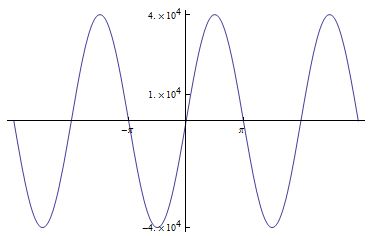
Plot[40000.  Sin[x], {x, -3 Pi, 3 Pi}, 
 Ticks -> {{-Pi, 0, Pi}, 
           {#, ScientificForm@#} & /@ {-40000., 40000., 10000.}}]

enter image description here

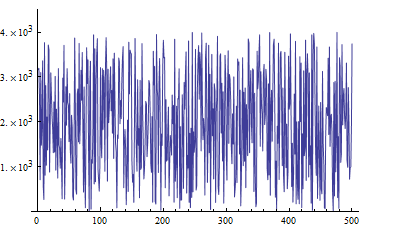
fakedata = Transpose[{Range[500], RandomReal[4000, {500}]}];
ListLinePlot[fakedata, 
 Ticks -> {Automatic, {#, ScientificForm@#} & /@  Range[0., 4000., 1000.]}, 
 PlotRange -> {0, 4500}]

enter image description here

Source Link
kglr
  • 400.5k
  • 18
  • 488
  • 929

Plot[40000.  Sin[x], {x, -3 Pi, 3 Pi}, 
 Ticks -> {{-Pi, 0, Pi}, 
           {#, ScientificForm@#} & /@ {-40000., 40000., 10000.}}]

enter image description here