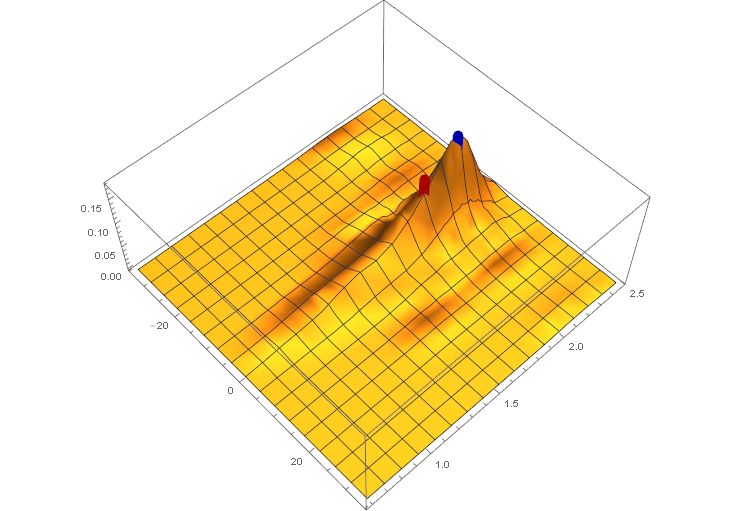
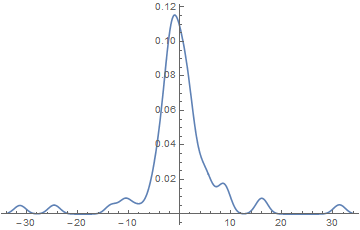
A visualization of the PDF together with a red line at the mean point and a blue line at the maximum point
Module[{dist = SmoothKernelDistribution[Transpose[{xValues, yValues}]],
   meanPoint = Mean[ed2D], maxPoint},
  maxPoint = ArgMax[PDF[dist, {x, y}], {x, y}];
  Show[Plot3D[Evaluate[PDF[dist, {x, y}]],
    {x, Min[xValues] - 2 First@dist["Bandwidth"], Max[xValues] + 2 First@dist["Bandwidth"]},
    {y, Min[yValues] - 2 Last@dist["Bandwidth"], Max[yValues] + 2 Last@dist["Bandwidth"]},
    PlotRange -> All],
   Graphics3D[{Darker@Red, Thickness[.02],
    Line[{Append[meanPoint, 0], Append[meanPoint, 0.13]}]}],
   Graphics3D[{Darker@Blue, Thickness[.02],
    Line[{Append[maxPoint, 0], Append[maxPoint, 0.18]}]}] ]]


