added 21 characters in body
Source Link
Putterboy
  • 4.7k
  • 1
  • 21
  • 31

Thanks to Rahul Narain for pointing out my oversight, and thanks to Timothy Wofford for his suggestion. Here, I revised my code as below. I still keep on using the function DiscretizeGraphics because I can't get rid of the ugly boundaries produced by ListSurfacePlot3D.

Code for viewpoint & position adjustment:

model = Import["c:\\turtle.obj"];
vp = OptionValue[Graphics3D, ViewPoint];
vv = OptionValue[Graphics3D, ViewVertical];
vc = OptionValue[Graphics3D, ViewCenter];
va = OptionValue[Graphics3D, ViewAngle];
vpoint = {-0.5  , 0.8 , 3 };
vvertical = {0.1 , 2 , 0.5};
vcenter = {{0.5 , 0.5 , 0.5 }, {0.5 , 0.5 }};
vangle = 0.2;
Show[model, Background -> Black,
 ViewPoint -> Dynamic[vp, (vp = #; vpoint = #) &],
 ViewVertical -> Dynamic[vv, (vv = #; vvertical = #) &],
 ViewCenter -> Dynamic[vc, (vc = #; vcenter = #) &],
 ViewAngle -> Dynamic[va, (va = #; vangle = #) &],
 ImageSize -> {300, 300}]
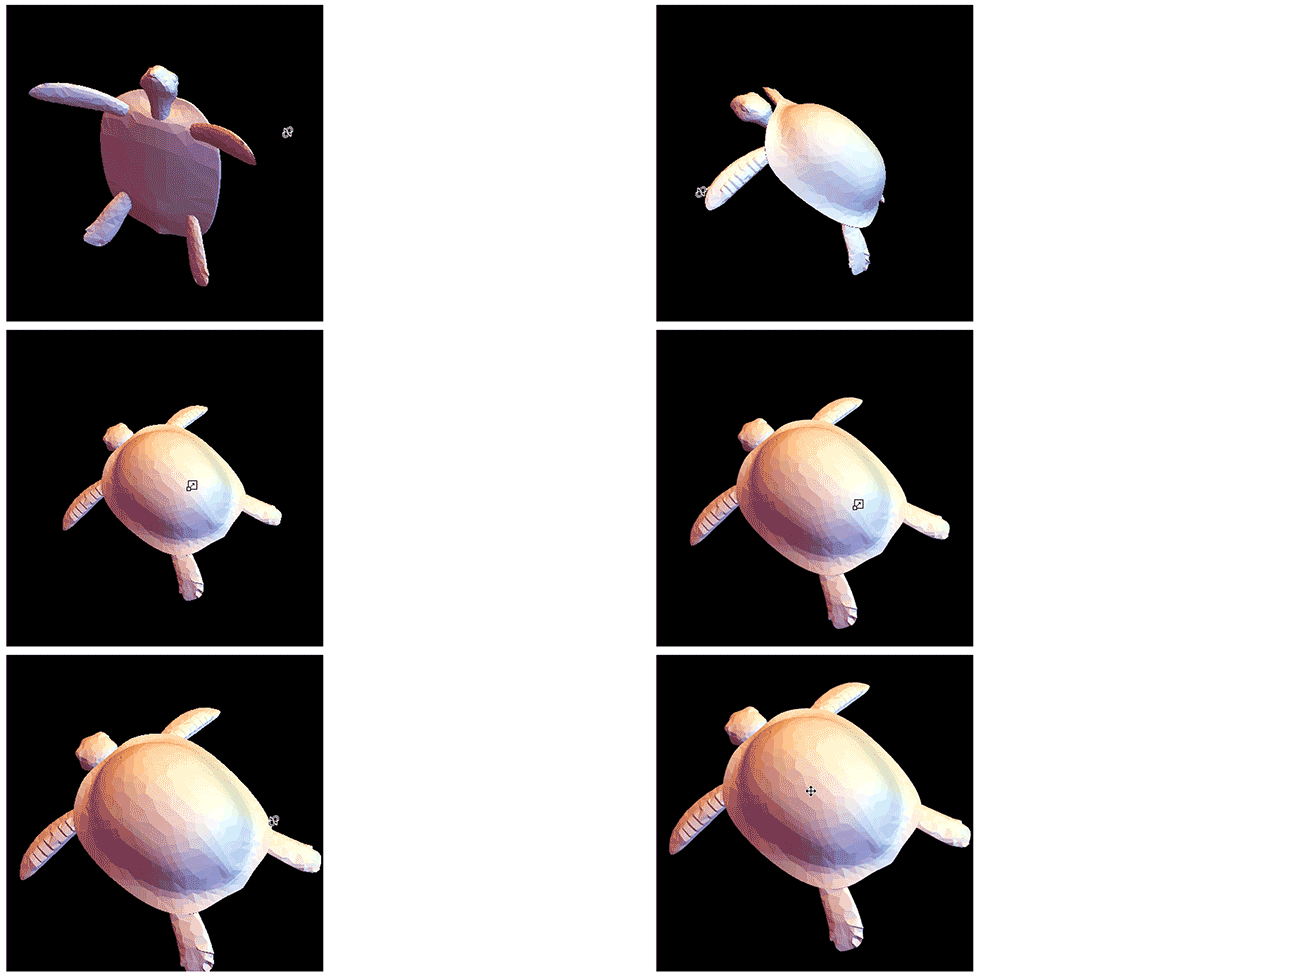
(Drag for rotation, Shift-Drag for position, Alt-Drag for zooming)

Code for producing the depth-map after the adjustment:

region = DiscretizeGraphics[model];
vdata = Import["c:\\turtle.obj" , "VertexData"];
viewPoint = vpoint;
{min, max} = {Min@#, Max@#} &@(EuclideanDistance[#, viewPoint] & /@ vdata);
Rasterize@RegionPlot3D[region, 
  ColorFunction -> (Glow[
      GrayLevel[ (max - EuclideanDistance[{#1, #2, #3}, viewPoint])/(max - min)]] &),
  ViewPoint -> vpoint,
  ViewVertical -> vvertical,
  ViewCenter -> vcenter,
  ViewAngle -> vangle,
  Background -> Black,
  Boxed -> False,
  Lighting -> None]

enter image description here

Thanks to Rahul Narain for pointing out my oversight, and thanks to Timothy Wofford for his suggestion. Here, I revised my code as below. I still keep on using the function DiscretizeGraphics because I can't get rid of the ugly boundaries produced by ListSurfacePlot3D.

Code for viewpoint & position adjustment:

model = Import["c:\\turtle.obj"];
vp = OptionValue[Graphics3D, ViewPoint];
vv = OptionValue[Graphics3D, ViewVertical];
vc = OptionValue[Graphics3D, ViewCenter];
va = OptionValue[Graphics3D, ViewAngle];
vpoint = {-0.5  , 0.8 , 3 };
vvertical = {0.1 , 2 , 0.5};
vcenter = {{0.5 , 0.5 , 0.5 }, {0.5 , 0.5 }};
vangle = 0.2;
Show[model, Background -> Black,
 ViewPoint -> Dynamic[vp, (vp = #; vpoint = #) &],
 ViewVertical -> Dynamic[vv, (vv = #; vvertical = #) &],
 ViewCenter -> Dynamic[vc, (vc = #; vcenter = #) &],
 ViewAngle -> Dynamic[va, (va = #; vangle = #) &],
 ImageSize -> {300, 300}]

(Drag for rotation, Shift-Drag for position, Alt-Drag for zooming)

Code for producing the depth-map:

region = DiscretizeGraphics[model];
vdata = Import["c:\\turtle.obj" , "VertexData"];
viewPoint = vpoint;
{min, max} = {Min@#, Max@#} &@(EuclideanDistance[#, viewPoint] & /@ vdata);
Rasterize@RegionPlot3D[region, 
  ColorFunction -> (Glow[
      GrayLevel[ (max - EuclideanDistance[{#1, #2, #3}, viewPoint])/(max - min)]] &),
  ViewPoint -> vpoint,
  ViewVertical -> vvertical,
  ViewCenter -> vcenter,
  ViewAngle -> vangle,
  Background -> Black,
  Boxed -> False,
  Lighting -> None]

enter image description here

Thanks to Rahul Narain for pointing out my oversight, and thanks to Timothy Wofford for his suggestion. Here, I revised my code as below. I still keep on using the function DiscretizeGraphics because I can't get rid of the ugly boundaries produced by ListSurfacePlot3D.

Code for viewpoint & position adjustment:

model = Import["c:\\turtle.obj"];
vp = OptionValue[Graphics3D, ViewPoint];
vv = OptionValue[Graphics3D, ViewVertical];
vc = OptionValue[Graphics3D, ViewCenter];
va = OptionValue[Graphics3D, ViewAngle];
vpoint = {-0.5  , 0.8 , 3 };
vvertical = {0.1 , 2 , 0.5};
vcenter = {{0.5 , 0.5 , 0.5 }, {0.5 , 0.5 }};
vangle = 0.2;
Show[model, Background -> Black,
 ViewPoint -> Dynamic[vp, (vp = #; vpoint = #) &],
 ViewVertical -> Dynamic[vv, (vv = #; vvertical = #) &],
 ViewCenter -> Dynamic[vc, (vc = #; vcenter = #) &],
 ViewAngle -> Dynamic[va, (va = #; vangle = #) &],
 ImageSize -> {300, 300}]

(Drag for rotation, Shift-Drag for position, Alt-Drag for zooming)

Code for producing the depth-map after the adjustment:

region = DiscretizeGraphics[model];
vdata = Import["c:\\turtle.obj" , "VertexData"];
viewPoint = vpoint;
{min, max} = {Min@#, Max@#} &@(EuclideanDistance[#, viewPoint] & /@ vdata);
Rasterize@RegionPlot3D[region, 
  ColorFunction -> (Glow[
      GrayLevel[ (max - EuclideanDistance[{#1, #2, #3}, viewPoint])/(max - min)]] &),
  ViewPoint -> vpoint,
  ViewVertical -> vvertical,
  ViewCenter -> vcenter,
  ViewAngle -> vangle,
  Background -> Black,
  Boxed -> False,
  Lighting -> None]

enter image description here

added 62 characters in body
Source Link
Putterboy
  • 4.7k
  • 1
  • 21
  • 31

Thanks to Rahul Narain for pointing out my oversight, and thanks to Timothy Wofford for his suggestion. Here, I revised my code as below. I still keep on using the function DiscretizeGraphics because I can't get rid of the ugly boundaries produced by ListSurfacePlot3D.

Code for viewpoint & position adjustment:

model = Import["c:\\turtle.obj"];
vp = OptionValue[Graphics3D, ViewPoint];
vv = OptionValue[Graphics3D, ViewVertical];
vc = OptionValue[Graphics3D, ViewCenter];
va = OptionValue[Graphics3D, ViewAngle];
vpoint = {-0.5  , 0.8 , 3 };
vvertical = {0.1 , 2 , 0.5};
vcenter = {{0.5 , 0.5 , 0.5 }, {0.5 , 0.5 }};
vangle = {};0.2;
Show[model, Background -> Black,
 ViewPoint -> Dynamic[vp, (vp = #; vpoint = #) &],
 ViewVertical -> Dynamic[vv, (vv = #; vvertical = #) &],
 ViewCenter -> Dynamic[vc, (vc = #; vcenter = #) &],
 ViewAngle -> Dynamic[va, (va = #; vangle = #) &],
 ImageSize -> {300, 300}]

(Drag for rotation, Shift-Drag for position, Alt-Drag for zooming)

Code for producing the depth-map:

region = DiscretizeGraphics[model];
vdata = Import["c:\\turtle.obj" , "VertexData"];
viewPoint = vpoint;
{min, max} = {Min@#, Max@#} &@(EuclideanDistance[#, viewPoint] & /@ vdata);
Rasterize@RegionPlot3D[region, 
  ColorFunction -> (Glow[
      GrayLevel[ (max - EuclideanDistance[{#1, #2, #3}, viewPoint])/(max - min)]] &),
  ViewPoint -> vpoint,
  ViewVertical -> vvertical,
  ViewCenter -> vcenter,
  ViewAngle -> vangle,
  Background -> Black,
  Boxed -> False,
  Lighting -> None]

enter image description here

Thanks to Rahul Narain for pointing out my oversight, and thanks to Timothy Wofford for his suggestion. Here, I revised my code as below. I still keep on using the function DiscretizeGraphics because I can't get rid of the ugly boundaries produced by ListSurfacePlot3D.

Code for viewpoint & position adjustment:

model = Import["c:\\turtle.obj"];
vp = OptionValue[Graphics3D, ViewPoint];
vv = OptionValue[Graphics3D, ViewVertical];
vc = OptionValue[Graphics3D, ViewCenter];
va = OptionValue[Graphics3D, ViewAngle];
vpoint = {};
vvertical = {};
vcenter = {};
vangle = {};
Show[model, Background -> Black,
 ViewPoint -> Dynamic[vp, (vp = #; vpoint = #) &],
 ViewVertical -> Dynamic[vv, (vv = #; vvertical = #) &],
 ViewCenter -> Dynamic[vc, (vc = #; vcenter = #) &],
 ViewAngle -> Dynamic[va, (va = #; vangle = #) &],
 ImageSize -> {300, 300}]

(Drag for rotation, Shift-Drag for position, Alt-Drag for zooming)

Code for producing the depth-map:

region = DiscretizeGraphics[model];
vdata = Import["c:\\turtle.obj" , "VertexData"];
viewPoint = vpoint;
{min, max} = {Min@#, Max@#} &@(EuclideanDistance[#, viewPoint] & /@ vdata);
Rasterize@RegionPlot3D[region, 
  ColorFunction -> (Glow[
      GrayLevel[ (max - EuclideanDistance[{#1, #2, #3}, viewPoint])/(max - min)]] &),
  ViewPoint -> vpoint,
  ViewVertical -> vvertical,
  ViewCenter -> vcenter,
  ViewAngle -> vangle,
  Background -> Black,
  Boxed -> False,
  Lighting -> None]

enter image description here

Thanks to Rahul Narain for pointing out my oversight, and thanks to Timothy Wofford for his suggestion. Here, I revised my code as below. I still keep on using the function DiscretizeGraphics because I can't get rid of the ugly boundaries produced by ListSurfacePlot3D.

Code for viewpoint & position adjustment:

model = Import["c:\\turtle.obj"];
vp = OptionValue[Graphics3D, ViewPoint];
vv = OptionValue[Graphics3D, ViewVertical];
vc = OptionValue[Graphics3D, ViewCenter];
va = OptionValue[Graphics3D, ViewAngle];
vpoint = {-0.5  , 0.8 , 3 };
vvertical = {0.1 , 2 , 0.5};
vcenter = {{0.5 , 0.5 , 0.5 }, {0.5 , 0.5 }};
vangle = 0.2;
Show[model, Background -> Black,
 ViewPoint -> Dynamic[vp, (vp = #; vpoint = #) &],
 ViewVertical -> Dynamic[vv, (vv = #; vvertical = #) &],
 ViewCenter -> Dynamic[vc, (vc = #; vcenter = #) &],
 ViewAngle -> Dynamic[va, (va = #; vangle = #) &],
 ImageSize -> {300, 300}]

(Drag for rotation, Shift-Drag for position, Alt-Drag for zooming)

Code for producing the depth-map:

region = DiscretizeGraphics[model];
vdata = Import["c:\\turtle.obj" , "VertexData"];
viewPoint = vpoint;
{min, max} = {Min@#, Max@#} &@(EuclideanDistance[#, viewPoint] & /@ vdata);
Rasterize@RegionPlot3D[region, 
  ColorFunction -> (Glow[
      GrayLevel[ (max - EuclideanDistance[{#1, #2, #3}, viewPoint])/(max - min)]] &),
  ViewPoint -> vpoint,
  ViewVertical -> vvertical,
  ViewCenter -> vcenter,
  ViewAngle -> vangle,
  Background -> Black,
  Boxed -> False,
  Lighting -> None]

enter image description here

added 54 characters in body
Source Link
Putterboy
  • 4.7k
  • 1
  • 21
  • 31

Thanks to Rahul Narain for pointing out my oversight, and thanks to Timothy Wofford for his suggestion. Here, I revised my code as below. I still keep on using the function DiscretizeGraphics because I can't get rid of the ugly boundaries produced by ListSurfacePlot3D.

Code for viewpoint & position adjustment:

model = Import["c:\\turtle.obj"];
vp = OptionValue[Graphics3D, ViewPoint];
vv = OptionValue[Graphics3D, ViewVertical];
vc = OptionValue[Graphics3D, ViewCenter];
va = OptionValue[Graphics3D, ViewAngle];
vpoint = {};
vvertical = {};
vcenter = {};
vangle = {};
Show[model, Background -> Black,
 ViewPoint -> Dynamic[vp, (vp = #; vpoint = #) &],
 ViewVertical -> Dynamic[vv, (vv = #; vvertical = #) &],
 ViewCenter -> Dynamic[vc, (vc = #; vcenter = #) &],
 ViewAngle -> Dynamic[va, (va = #; vangle = #) &],
 ImageSize -> {300, 300}]

(Drag for rotation, Shift-Drag for position, Alt-Drag for zooming)

Code for producing the depth-map:

region = DiscretizeGraphics[model];
vdata = Import["c:\\turtle.obj" , "VertexData"];
viewPoint = vpoint;
{min, max} = {Min@#, Max@#} &@(EuclideanDistance[#, viewPoint] & /@ vdata);
Rasterize@RegionPlot3D[region, 
  ColorFunction -> (Glow[
      GrayLevel[ (max - EuclideanDistance[{#1, #2, #3}, viewPoint])/(max - min)]] &),
  ViewPoint -> vpoint,
  ViewVertical -> vvertical,
  ViewCenter -> vcenter,
  ViewAngle -> vangle,
  Background -> Black,
  Boxed -> False,
  Lighting -> None]

enter image description here

Thanks to Rahul Narain for pointing out my oversight, and thanks to Timothy Wofford for his suggestion. Here, I revised my code as below. I still keep on using the function DiscretizeGraphics because I can't get rid of the ugly boundaries produced by ListSurfacePlot3D.

Code for viewpoint & position adjustment:

model = Import["c:\\turtle.obj"];
vp = OptionValue[Graphics3D, ViewPoint];
vv = OptionValue[Graphics3D, ViewVertical];
vc = OptionValue[Graphics3D, ViewCenter];
va = OptionValue[Graphics3D, ViewAngle];
vpoint = {};
vvertical = {};
vcenter = {};
vangle = {};
Show[model, Background -> Black,
 ViewPoint -> Dynamic[vp, (vp = #; vpoint = #) &],
 ViewVertical -> Dynamic[vv, (vv = #; vvertical = #) &],
 ViewCenter -> Dynamic[vc, (vc = #; vcenter = #) &],
 ViewAngle -> Dynamic[va, (va = #; vangle = #) &],
 ImageSize -> {300, 300}]

(Drag for rotation, Shift-Drag for position, Alt-Drag for zooming)

Code for producing the depth-map:

region = DiscretizeGraphics[model];
vdata = Import["c:\\turtle.obj" , "VertexData"];
viewPoint = vpoint;
{min, max} = {Min@#, Max@#} &@(EuclideanDistance[#, viewPoint] & /@ vdata);
Rasterize@RegionPlot3D[region, 
  ColorFunction -> (Glow[
      GrayLevel[ (max - EuclideanDistance[{#1, #2, #3}, viewPoint])/(max - min)]] &),
  ViewPoint -> vpoint,
  ViewVertical -> vvertical,
  ViewCenter -> vcenter,
  ViewAngle -> vangle,
  Background -> Black,
  Boxed -> False,
  Lighting -> None]

enter image description here

added 55 characters in body
Source Link
Putterboy
  • 4.7k
  • 1
  • 21
  • 31
Loading
Source Link
Putterboy
  • 4.7k
  • 1
  • 21
  • 31
Loading