Extended response to V9
Source Link
user9660
user9660

You can use, i.e. specify FontFamily for your choice of font, if the font is installed on your system the font will be embedded:

?? FontFamily

FontFamily is an option for Style and Cell that specifies the font family in which text should be rendered.  >>

Attributes[FontFamily]={Protected}

.

SetDirectory@NotebookDirectory[];

.

plot = Plot[
  {Sin[x], Cos[x]}
  , {x, -\[Pi], \[Pi]}
  , FrameLabel -> {{y, Sin[x]}, {x, "plot"}}
  , LabelStyle -> {FontFamily -> "Times", 14, GrayLevel[0]}
  , PlotTheme -> "Detailed"
  , FrameTicks -> {Range[-\[Pi], \[Pi], \[Pi]/2], Automatic}
  ]
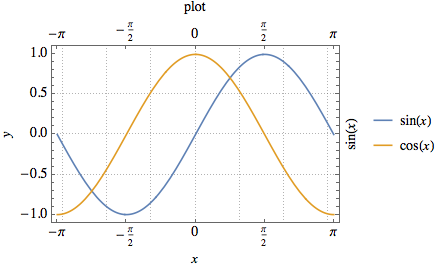
enter image description here

Export["test.pdf", plot]

enter image description here

Edit

As @Verbeia justly remarks, I should answer the question in full, with V9 one can use

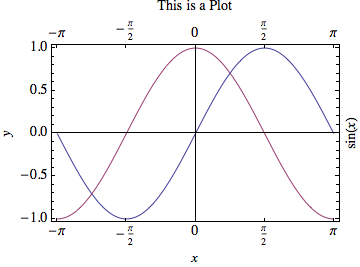
plot = Plot[{Sin[x], Cos[x]}
  , {x, -\[Pi], \[Pi]}
  , Frame -> True
  , FrameLabel -> {{y, Sin[x]}, {x, "This is a Plot"}}
  , LabelStyle -> {FontFamily -> "Times", 14, GrayLevel[0]}
  , FrameTicks -> {Range[-\[Pi], \[Pi], \[Pi]/2], Automatic}]

The most standard fonts are correctly embedded. One advantage is to use fonts that have a matured character level of mathematic characters.
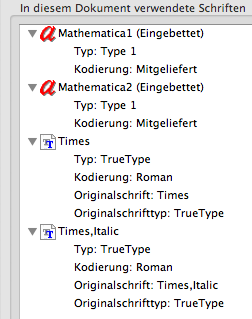
enter image description here

enter image description here

You can use, i.e. specify FontFamily for your choice of font, if the font is installed on your system the font will be embedded:

?? FontFamily

FontFamily is an option for Style and Cell that specifies the font family in which text should be rendered.  >>

Attributes[FontFamily]={Protected}

.

SetDirectory@NotebookDirectory[];

.

plot = Plot[
  {Sin[x], Cos[x]}
  , {x, -\[Pi], \[Pi]}
  , FrameLabel -> {{y, Sin[x]}, {x, "plot"}}
  , LabelStyle -> {FontFamily -> "Times", 14, GrayLevel[0]}
  , PlotTheme -> "Detailed"
  , FrameTicks -> {Range[-\[Pi], \[Pi], \[Pi]/2], Automatic}
  ]

enter image description here

Export["test.pdf", plot]

enter image description here

Edit

As @Verbeia justly remarks, I should answer the question in full, with V9 one can use

plot = Plot[{Sin[x], Cos[x]}
  , {x, -\[Pi], \[Pi]}
  , Frame -> True
  , FrameLabel -> {{y, Sin[x]}, {x, "This is a Plot"}}
  , LabelStyle -> {FontFamily -> "Times", 14, GrayLevel[0]}
  , FrameTicks -> {Range[-\[Pi], \[Pi], \[Pi]/2], Automatic}]

The most standard fonts are correctly embedded. One advantage is to use fonts that have a matured character level of mathematic characters.

enter image description here

enter image description here

Source Link
user9660
user9660

You can use, i.e. specify FontFamily for your choice of font, if the font is installed on your system the font will be embedded:

?? FontFamily

FontFamily is an option for Style and Cell that specifies the font family in which text should be rendered.  >>

Attributes[FontFamily]={Protected}

.

SetDirectory@NotebookDirectory[];

.

plot = Plot[
  {Sin[x], Cos[x]}
  , {x, -\[Pi], \[Pi]}
  , FrameLabel -> {{y, Sin[x]}, {x, "plot"}}
  , LabelStyle -> {FontFamily -> "Times", 14, GrayLevel[0]}
  , PlotTheme -> "Detailed"
  , FrameTicks -> {Range[-\[Pi], \[Pi], \[Pi]/2], Automatic}
  ]

enter image description here

Export["test.pdf", plot]

enter image description here