added 592 characters in body
Source Link
kglr
  • 400.5k
  • 18
  • 488
  • 929

Update

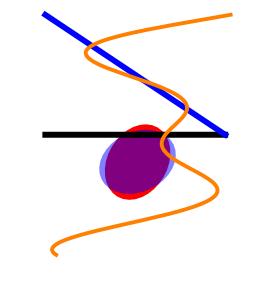
As noted in the comments by @pickett, the function showF in the original post does not preserve the relative positions of the inset graphics. I am not sure if it is possible to fix showF to address this issue. So, instead, I suggest an alternative approach using

show2F := Show[# /. Rotate[Graphics[x_, y___], r__] :> Graphics[Rotate[x, r], y],
              PlotRange -> All, ImagePadding -> Scaled[.025]] &

show2F@{e1, e2, e3}
enter image description here


Original post

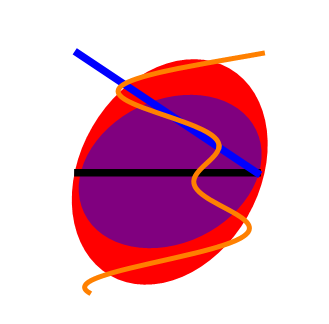
An alternative approach similar to @mfvonh's replacement trick: Wrap inner graphics with Inset and the whole thing with Graphics

showF := Graphics[# /. Graphics -> Composition[Inset, Graphics]] &

or using the new Version10 syntax (thanks: @rojo)

Graphics@*ReplaceAll[Graphics->Inset@*Graphics]

Examples:

g1 = Graphics[{Red, Disk[{0, 0}, {1/3, 1/4}]}, ImageSize -> 250];
g2 = Graphics[{Blue, Opacity[.5], Disk[{0, 0}, {1/3, 1/4}]}, ImageSize -> 200];
g3 = Graphics[{Thickness[.03], Line[{{0, -1/2}, {0, 1}}], 
             {Blue, Line[{{0, -1/2}, {1, 1}}]}, 
             First@Plot[x Sin[6 x + 4], {x, -1, 1}, Axes -> False, 
                       PlotStyle -> {Thickness[.02], Orange}]}, ImageSize -> 250];
Row[{g1, g2, g3}]

enter image description here

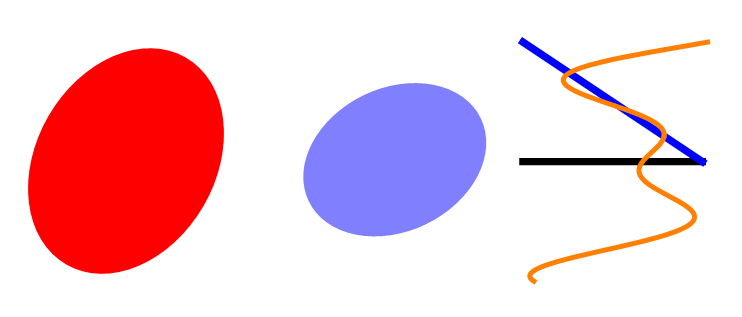
e1 = Rotate[g1, Pi / 3];
e2 = Rotate[g2, Pi / 7];
e3 = Rotate[g3, Pi / 2];
Row[{e1, e2, e3}]
enter image description here

showF @ {e1, e2, e3}

enter image description here

An alternative approach similar to @mfvonh's replacement trick: Wrap inner graphics with Inset and the whole thing with Graphics

showF := Graphics[# /. Graphics -> Composition[Inset, Graphics]] &

Examples:

g1 = Graphics[{Red, Disk[{0, 0}, {1/3, 1/4}]}, ImageSize -> 250];
g2 = Graphics[{Blue, Opacity[.5], Disk[{0, 0}, {1/3, 1/4}]}, ImageSize -> 200];
g3 = Graphics[{Thickness[.03], Line[{{0, -1/2}, {0, 1}}], 
             {Blue, Line[{{0, -1/2}, {1, 1}}]}, 
             First@Plot[x Sin[6 x + 4], {x, -1, 1}, Axes -> False, 
                       PlotStyle -> {Thickness[.02], Orange}]}, ImageSize -> 250];
Row[{g1, g2, g3}]

enter image description here

e1 = Rotate[g1, Pi / 3];
e2 = Rotate[g2, Pi / 7];
e3 = Rotate[g3, Pi / 2];
Row[{e1, e2, e3}]

enter image description here

showF @ {e1, e2, e3}

enter image description here

Update

As noted in the comments by @pickett, the function showF in the original post does not preserve the relative positions of the inset graphics. I am not sure if it is possible to fix showF to address this issue. So, instead, I suggest an alternative approach using

show2F := Show[# /. Rotate[Graphics[x_, y___], r__] :> Graphics[Rotate[x, r], y],
              PlotRange -> All, ImagePadding -> Scaled[.025]] &

show2F@{e1, e2, e3}

enter image description here


Original post

An alternative approach similar to @mfvonh's replacement trick: Wrap inner graphics with Inset and the whole thing with Graphics

showF := Graphics[# /. Graphics -> Composition[Inset, Graphics]] &

or using the new Version10 syntax (thanks: @rojo)

Graphics@*ReplaceAll[Graphics->Inset@*Graphics]

Examples:

g1 = Graphics[{Red, Disk[{0, 0}, {1/3, 1/4}]}, ImageSize -> 250];
g2 = Graphics[{Blue, Opacity[.5], Disk[{0, 0}, {1/3, 1/4}]}, ImageSize -> 200];
g3 = Graphics[{Thickness[.03], Line[{{0, -1/2}, {0, 1}}], 
             {Blue, Line[{{0, -1/2}, {1, 1}}]}, 
             First@Plot[x Sin[6 x + 4], {x, -1, 1}, Axes -> False, 
                       PlotStyle -> {Thickness[.02], Orange}]}, ImageSize -> 250];
Row[{g1, g2, g3}]

enter image description here

e1 = Rotate[g1, Pi / 3];
e2 = Rotate[g2, Pi / 7];
e3 = Rotate[g3, Pi / 2];
Row[{e1, e2, e3}]

enter image description here

showF @ {e1, e2, e3}

enter image description here

added 69 characters in body
Source Link
kglr
  • 400.5k
  • 18
  • 488
  • 929

An alternative approach similar to @mfvonh's replacement trick: Wrap inner graphics with Inset and the whole thing with Graphics

showF := Graphics[# /. Graphics -> Composition[Inset, Graphics]] &

Examples:

g1 = Graphics[{Red, Disk[{0, 0}, {1/3, 1/4}]}, ImageSize -> 250];
g2 = Graphics[{Blue, Opacity[.5], Disk[{0, 0}, {1/3, 1/4}]}, ImageSize -> 200];
g3 = Graphics[{Thickness[.03], Line[{{0, -1/2}, {0, 1}}], 
             {Blue, Line[{{0, -1/2}, {1, 1}}]}, 
             First@Plot[x Sin[6 x + 4], {x, -1, 1}, Axes -> False, 
                       PlotStyle -> {Thickness[.02], Orange}]}, ImageSize -> 250];
Row[{g1, g2, g3}]

enter image description here

e1 = Rotate[g1, Pi / 3];
e2 = Rotate[g2, Pi / 7];
e3 = Rotate[g3, Pi / 2];
Row[{e1, e2, e3}]

enter image description here

showF @ {e1, e2, e3}

enter image description here

An alternative approach similar to @mfvonh's replacement trick:

showF := Graphics[# /. Graphics -> Composition[Inset, Graphics]] &

Examples:

g1 = Graphics[{Red, Disk[{0, 0}, {1/3, 1/4}]}, ImageSize -> 250];
g2 = Graphics[{Blue, Opacity[.5], Disk[{0, 0}, {1/3, 1/4}]}, ImageSize -> 200];
g3 = Graphics[{Thickness[.03], Line[{{0, -1/2}, {0, 1}}], 
             {Blue, Line[{{0, -1/2}, {1, 1}}]}, 
             First@Plot[x Sin[6 x + 4], {x, -1, 1}, Axes -> False, 
                       PlotStyle -> {Thickness[.02], Orange}]}, ImageSize -> 250];
Row[{g1, g2, g3}]

enter image description here

e1 = Rotate[g1, Pi / 3];
e2 = Rotate[g2, Pi / 7];
e3 = Rotate[g3, Pi / 2];
Row[{e1, e2, e3}]

enter image description here

showF @ {e1, e2, e3}

enter image description here

An alternative approach similar to @mfvonh's replacement trick: Wrap inner graphics with Inset and the whole thing with Graphics

showF := Graphics[# /. Graphics -> Composition[Inset, Graphics]] &

Examples:

g1 = Graphics[{Red, Disk[{0, 0}, {1/3, 1/4}]}, ImageSize -> 250];
g2 = Graphics[{Blue, Opacity[.5], Disk[{0, 0}, {1/3, 1/4}]}, ImageSize -> 200];
g3 = Graphics[{Thickness[.03], Line[{{0, -1/2}, {0, 1}}], 
             {Blue, Line[{{0, -1/2}, {1, 1}}]}, 
             First@Plot[x Sin[6 x + 4], {x, -1, 1}, Axes -> False, 
                       PlotStyle -> {Thickness[.02], Orange}]}, ImageSize -> 250];
Row[{g1, g2, g3}]

enter image description here

e1 = Rotate[g1, Pi / 3];
e2 = Rotate[g2, Pi / 7];
e3 = Rotate[g3, Pi / 2];
Row[{e1, e2, e3}]

enter image description here

showF @ {e1, e2, e3}

enter image description here

Source Link
kglr
  • 400.5k
  • 18
  • 488
  • 929

An alternative approach similar to @mfvonh's replacement trick:

showF := Graphics[# /. Graphics -> Composition[Inset, Graphics]] &

Examples:

g1 = Graphics[{Red, Disk[{0, 0}, {1/3, 1/4}]}, ImageSize -> 250];
g2 = Graphics[{Blue, Opacity[.5], Disk[{0, 0}, {1/3, 1/4}]}, ImageSize -> 200];
g3 = Graphics[{Thickness[.03], Line[{{0, -1/2}, {0, 1}}], 
             {Blue, Line[{{0, -1/2}, {1, 1}}]}, 
             First@Plot[x Sin[6 x + 4], {x, -1, 1}, Axes -> False, 
                       PlotStyle -> {Thickness[.02], Orange}]}, ImageSize -> 250];
Row[{g1, g2, g3}]

enter image description here

e1 = Rotate[g1, Pi / 3];
e2 = Rotate[g2, Pi / 7];
e3 = Rotate[g3, Pi / 2];
Row[{e1, e2, e3}]

enter image description here

showF @ {e1, e2, e3}

enter image description here