edited tags
Source Link
Szabolcs
  • 236.5k
  • 31
  • 641
  • 1.3k

Note: this is fixed in version 9.


My question concerns the usage of NExpectation and Expectation and why I see the behavior I see in the following example.

First take some data and derive an EmpiricalDistribution:

data = {4, 104, 96, 80, 22, 76, 106, 18, 98, 44, 112, 78, 50, 120, 2, 6, 
        100, 10, 68, 80, 42, 66, 100, 58, 4, 76, 18, 102, 6, 16, 52, 32, 62, 
        36, 18, 4, 54, 98, 38, 74, 16, 22, 102, 2, 2, 4, 22, 72, 100, 82, 48, 
        16, 34, 44, 130, 50, 48, 74, 60, 96, 8, 118, 30, 58, 84, 4, 70, 66, 
        40, 14, 92, 68, 42, 56, 56, 16, 40, 12, 22, 26, 98, 4, 80, 100, 36, 
        88, 48, 26, 28, 94, 22, 26, 78, 16, 52, 8, 10, 2};

dist = EmpiricalDistribution[data];

You can plot PDFs and CDFs of the distribution:

Row[{DiscretePlot[PDF[dist, x], {x, data}, Joined -> True, ImageSize -> 300], 
     DiscretePlot[CDF[dist, x], {x, 0, Max@data, 1}, Joined -> True, ImageSize -> 300]}]

They look like this:
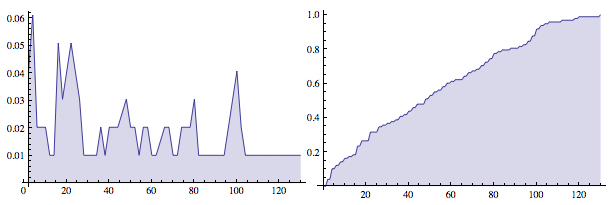
PDF & CDF plots

That covers the background. Now execute the following and it gets a little odd:

Expectation[X \[Conditioned] X > 4, X \[Distributed] dist]
NExpectation[X \[Conditioned] X > 4, X \[Distributed] dist]
N[Expectation[X \[Conditioned] X > 4, X \[Distributed] dist]]

620/11
NExpectation[X \[Conditioned] X > 4, X \[Distributed]DataDistribution[<<"Empirical">>, {51}]]
56.3636

So, what gives?

How come NExpectation[...] doesn't calculate an answer, but N[Expectation[...]] does? Clearly, Expectation handles EmpiricalDistribution without a problem. One would think that NExpectation would as well. Doesn't this seem odd? Just hoping that understanding why Mathematica does this might yield additional insights into Mathematica itself.

Note: this is fixed in version 9.


My question concerns the usage of NExpectation and Expectation and why I see the behavior I see in the following example.

First take some data and derive an EmpiricalDistribution:

data = {4, 104, 96, 80, 22, 76, 106, 18, 98, 44, 112, 78, 50, 120, 2, 6, 
        100, 10, 68, 80, 42, 66, 100, 58, 4, 76, 18, 102, 6, 16, 52, 32, 62, 
        36, 18, 4, 54, 98, 38, 74, 16, 22, 102, 2, 2, 4, 22, 72, 100, 82, 48, 
        16, 34, 44, 130, 50, 48, 74, 60, 96, 8, 118, 30, 58, 84, 4, 70, 66, 
        40, 14, 92, 68, 42, 56, 56, 16, 40, 12, 22, 26, 98, 4, 80, 100, 36, 
        88, 48, 26, 28, 94, 22, 26, 78, 16, 52, 8, 10, 2};

dist = EmpiricalDistribution[data];

You can plot PDFs and CDFs of the distribution:

Row[{DiscretePlot[PDF[dist, x], {x, data}, Joined -> True, ImageSize -> 300], 
     DiscretePlot[CDF[dist, x], {x, 0, Max@data, 1}, Joined -> True, ImageSize -> 300]}]

They look like this:

PDF & CDF plots

That covers the background. Now execute the following and it gets a little odd:

Expectation[X \[Conditioned] X > 4, X \[Distributed] dist]
NExpectation[X \[Conditioned] X > 4, X \[Distributed] dist]
N[Expectation[X \[Conditioned] X > 4, X \[Distributed] dist]]

620/11
NExpectation[X \[Conditioned] X > 4, X \[Distributed]DataDistribution[<<"Empirical">>, {51}]]
56.3636

So, what gives?

How come NExpectation[...] doesn't calculate an answer, but N[Expectation[...]] does? Clearly, Expectation handles EmpiricalDistribution without a problem. One would think that NExpectation would as well. Doesn't this seem odd? Just hoping that understanding why Mathematica does this might yield additional insights into Mathematica itself.

edited tags
Link
Tweeted twitter.com/#!/StackMma/status/200816492214878208
added 22 characters in body; edited title
Source Link
rm -rf
  • 89.3k
  • 21
  • 297
  • 479

NExpectation[] NExpectation behaves oddly with EmpiricalDistribution[]EmpiricalDistribution

My question concerns the usage of NExpectation[]NExpectation and Expectation[]Expectation and why I see the behavior I see in the following example.

First take some data and derive an EmpiricalDistribution[]EmpiricalDistribution:

    data = {4, 104, 96, 80, 22, 76, 106, 18, 98, 44, 112, 78, 50, 120, 2, 6, \
        100, 10, 68, 80, 42, 66, 100, 58, 4, 76, 18, 102, 6, 16, 52, 32, 62, \
        36, 18, 4, 54, 98, 38, 74, 16, 22, 102, 2, 2, 4, 22, 72, 100, 82, 48, \
        16, 34, 44, 130, 50, 48, 74, 60, 96, 8, 118, 30, 58, 84, 4, 70, 66, \
        40, 14, 92, 68, 42, 56, 56, 16, 40, 12, 22, 26, 98, 4, 80, 100, 36, \
        88, 48, 26, 28, 94, 22, 26, 78, 16, 52, 8, 10, 2};

dist = EmpiricalDistribution[data];

You can plot PDF[]sPDFs and CDF[]sCDFs of the distribution:

    Row[{DiscretePlot[PDF[dist, x], {x, data}, Joined -> True, 
   ImageSize -> 300], 
     DiscretePlot[CDF[dist, x], {x, 0, Max@data, 1}, Joined -> True, 
   ImageSize -> 300]}]

They look like this:

PDF & CDF plots

That covers the background. Now execute the following and it gets a little odd:

Expectation[X \[Conditioned] X > 4, X \[Distributed] dist]
NExpectation[X \[Conditioned] X > 4, X \[Distributed] dist]
N[Expectation[X \[Conditioned] X > 4, X \[Distributed] dist]]

620/11
NExpectation[X \[Conditioned] X > 4, X \[Distributed]DataDistribution[<<"Empirical">>, {51}]]
56.3636

So, what gives?

How come NExpectation[]NExpectation[...] doesn't calculate an answer, but N[Expectation[]]N[Expectation[...]] does? Clearly, Expectation[]Expectation handles EmpiricalDistribution[]EmpiricalDistribution without a problem. One would think that NExpectation[]NExpectation would as well. Doesn't this seem odd? Just hoping that understanding why Mathematica does this might yield additional insights into Mathematica itself.

NExpectation[] behaves oddly with EmpiricalDistribution[]

My question concerns the usage of NExpectation[] and Expectation[] and why I see the behavior I see in the following example.

First take some data and derive an EmpiricalDistribution[]:

    data = {4, 104, 96, 80, 22, 76, 106, 18, 98, 44, 112, 78, 50, 120, 2, 6, \
100, 10, 68, 80, 42, 66, 100, 58, 4, 76, 18, 102, 6, 16, 52, 32, 62, \
36, 18, 4, 54, 98, 38, 74, 16, 22, 102, 2, 2, 4, 22, 72, 100, 82, 48, \
16, 34, 44, 130, 50, 48, 74, 60, 96, 8, 118, 30, 58, 84, 4, 70, 66, \
40, 14, 92, 68, 42, 56, 56, 16, 40, 12, 22, 26, 98, 4, 80, 100, 36, \
88, 48, 26, 28, 94, 22, 26, 78, 16, 52, 8, 10, 2};

dist = EmpiricalDistribution[data];

You can plot PDF[]s and CDF[]s of the distribution:

    Row[{DiscretePlot[PDF[dist, x], {x, data}, Joined -> True, 
   ImageSize -> 300], 
  DiscretePlot[CDF[dist, x], {x, 0, Max@data, 1}, Joined -> True, 
   ImageSize -> 300]}]

They look like this:

PDF & CDF plots

That covers the background. Now execute the following and it gets a little odd:

Expectation[X \[Conditioned] X > 4, X \[Distributed] dist]
NExpectation[X \[Conditioned] X > 4, X \[Distributed] dist]
N[Expectation[X \[Conditioned] X > 4, X \[Distributed] dist]]

620/11
NExpectation[X \[Conditioned] X > 4, X \[Distributed]DataDistribution[<<"Empirical">>, {51}]]
56.3636

So, what gives?

How come NExpectation[] doesn't calculate an answer, but N[Expectation[]] does? Clearly, Expectation[] handles EmpiricalDistribution[] without a problem. One would think that NExpectation[] would as well. Doesn't this seem odd? Just hoping that understanding why Mathematica does this might yield additional insights into Mathematica itself.

NExpectation behaves oddly with EmpiricalDistribution

My question concerns the usage of NExpectation and Expectation and why I see the behavior I see in the following example.

First take some data and derive an EmpiricalDistribution:

data = {4, 104, 96, 80, 22, 76, 106, 18, 98, 44, 112, 78, 50, 120, 2, 6, 
        100, 10, 68, 80, 42, 66, 100, 58, 4, 76, 18, 102, 6, 16, 52, 32, 62, 
        36, 18, 4, 54, 98, 38, 74, 16, 22, 102, 2, 2, 4, 22, 72, 100, 82, 48, 
        16, 34, 44, 130, 50, 48, 74, 60, 96, 8, 118, 30, 58, 84, 4, 70, 66, 
        40, 14, 92, 68, 42, 56, 56, 16, 40, 12, 22, 26, 98, 4, 80, 100, 36, 
        88, 48, 26, 28, 94, 22, 26, 78, 16, 52, 8, 10, 2};

dist = EmpiricalDistribution[data];

You can plot PDFs and CDFs of the distribution:

Row[{DiscretePlot[PDF[dist, x], {x, data}, Joined -> True, ImageSize -> 300], 
     DiscretePlot[CDF[dist, x], {x, 0, Max@data, 1}, Joined -> True, ImageSize -> 300]}]

They look like this:

PDF & CDF plots

That covers the background. Now execute the following and it gets a little odd:

Expectation[X \[Conditioned] X > 4, X \[Distributed] dist]
NExpectation[X \[Conditioned] X > 4, X \[Distributed] dist]
N[Expectation[X \[Conditioned] X > 4, X \[Distributed] dist]]

620/11
NExpectation[X \[Conditioned] X > 4, X \[Distributed]DataDistribution[<<"Empirical">>, {51}]]
56.3636

So, what gives?

How come NExpectation[...] doesn't calculate an answer, but N[Expectation[...]] does? Clearly, Expectation handles EmpiricalDistribution without a problem. One would think that NExpectation would as well. Doesn't this seem odd? Just hoping that understanding why Mathematica does this might yield additional insights into Mathematica itself.

Source Link
Jagra
  • 14.6k
  • 1
  • 39
  • 82
Loading