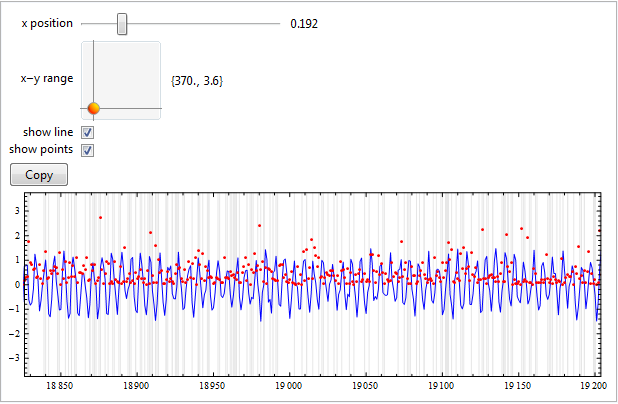
This might not answer all the speed-problems, but it is my solution to plot enormous datasets. By using a dynamic interface it is possible to only show (and keep in memory(?)) a small range of the whole plot, which makes visual analysis of and interaction with the plot much more fluid. The key point is to only update the PlotRange dynamically and not the entire plot.
It works nicely even when downsampling/interpolation is not possible, because e.g. each datapoint must be plotted. Both horizontal and vertical ranges can be set, and I also added some other functionality to test that it works as expected.
(* number of datapoints and some random datasets *)
n = 10^5;
lineData = Table[Sin[x] + RandomReal@{-.5, .5}, {x, 0, n, 1}];
pointData = RandomVariate[ExponentialDistribution@2, n];
timeData = RandomInteger[{0, n}, n/2];

DynamicModule[{plot, window = 0, range = {100, 2}, showLine = True,
  showPoints = True},
 Panel@Grid[{
    {"x position", Row@{Slider@Dynamic@window, Spacer@10, Dynamic@window}},
    {"x-y range", Row@{Slider2D[Dynamic@range, {{100, 1}, {3000, 30}}], Spacer@10, Dynamic@range}},
    {"show line", Checkbox@Dynamic@showLine},
    {"show points", Checkbox@Dynamic@showPoints},
    {Item[
      Dynamic@Item[
        Button["Copy", CopyToClipboard@plot, ImageSize -> 60]],
      Alignment -> Left], SpanFromLeft},
    {Item[Dynamic[plot = Show[
         If[showLine,
          ListPlot[lineData, Joined -> True, PlotStyle -> Blue,
           PlotRange -> All], Graphics@{}],
         If[showPoints,
          ListPlot[pointData, Joined -> False, PlotStyle -> Red,
           PlotRange -> All], Graphics@{}],
         ImageSize -> {600, 200}, AspectRatio -> Full, Frame -> True, Axes -> False,
         PlotRange ->
          Dynamic@{{Max[n*window - range[[1]], 0],
             Max[n*window, range[[1]]]}, {-range[[2]], range[[2]]}},
         PlotRangePadding -> {[email protected], [email protected]},
         GridLines -> {timeData, {}}, GridLinesStyle -> [email protected]],
       TrackedSymbols :> {showLine, showPoints}], Alignment -> Left],
     SpanFromLeft}
    }, Alignment -> {{Right, Left, Left}, Center}]]


