added 1509 characters in body
Source Link
Alexei Boulbitch
  • 40k
  • 2
  • 48
  • 100

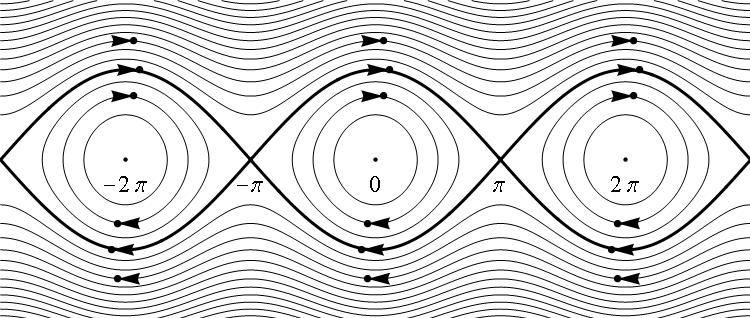
If you need to show the points at the arrow tips, you should specify them separately from the specification of the arrows. The points coordinates may be obtained from those of the arrows. Try this:

yielding the following: enter image description here Here ah specifies the arrow heads size, ps1 - specifies the points sizes in the centers of the cycles and ps2 - those at the arrow tips. I tried to save it as PDF and it works.
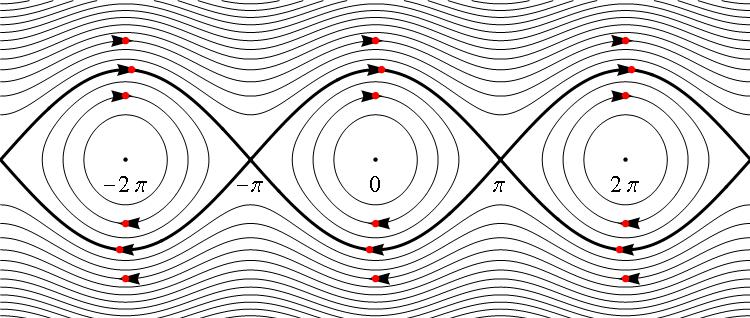
If you need that the points somewhat overlay the arrow tips, try this and play with the value of the parameter eps:

eps = 0.2;        
Framed[Show[
      ContourPlot[y^2 - Cos[x], {x, -3 Pi, 3 Pi}, {y, -2.5, 2.5}, 
       ContourShading -> None, ContourStyle -> Thickness[0.002], 
       PlotPoints -> 100, Frame -> None, Contours -> Range[-1, 7, 0.5], 
       AspectRatio -> 4/(3 Pi), PlotRangePadding -> 0], 
      ContourPlot[y^2 - Cos[x] == 1, {x, -3 Pi, 3 Pi}, {y, -2.5, 2.5}, 
       ContourShading -> None, ContourStyle -> Thickness[0.004], 
       PlotPoints -> 200, Frame -> None, AspectRatio -> 4/(3 Pi), 
       PlotRangePadding -> 0],
      
      Graphics[{Black, Arrowheads[ah], Thickness[0.0001], 
        Arrow[#] & /@ lstAr1, Arrow[#] & /@ lstAr2, 
        Arrow[#] & /@ lstAr3}], 
      Graphics[Append[
        Point[#] & /@ {{0, 0}, {Pi, 0}, {-Pi, 0}, {2 Pi, 0}, {-2 Pi, 0}}, 
        PointSize[ps1]]],
      
      Graphics[{Red, PointSize[ps2], 
        Point[#] & /@ (Join[lstAr1, lstAr2, lstAr3] /. {x_, y_} -> 
             y /. {x_, y_} -> If[y > 0, {x - eps, y}, {x + eps, y}])}], 
      Graphics[{Text[Style[0, textsize], {0, -0.4}], 
        Text[Style[\[Pi], textsize], {Pi, -0.4}], 
        Text[Style[-\[Pi], textsize], {-Pi, -0.4}], 
        Text[Style[2 \[Pi], textsize], {2 Pi, -0.4}], 
        Text[Style[-2 \[Pi], textsize], {-2 Pi, -0.4}]}], 
      ImageSize -> 500]]
enter image description here

If you need to show the points at the arrow tips, you should specify them separately from the specification of arrows. The points coordinates may be obtained from those of the arrows. Try this:

yielding the following: enter image description here Here ah specifies the arrow heads size, ps1 - specifies the points sizes in the centers of the cycles and ps2 - those at the arrow tips. I tried to save it as PDF and it works.

If you need to show the points at the arrow tips, you should specify them separately from the specification of the arrows. The points coordinates may be obtained from those of the arrows. Try this:

yielding the following: enter image description here Here ah specifies the arrow heads size, ps1 - specifies the points sizes in the centers of the cycles and ps2 - those at the arrow tips. I tried to save it as PDF and it works.

If you need that the points somewhat overlay the arrow tips, try this and play with the value of the parameter eps:

eps = 0.2;        
Framed[Show[
      ContourPlot[y^2 - Cos[x], {x, -3 Pi, 3 Pi}, {y, -2.5, 2.5}, 
       ContourShading -> None, ContourStyle -> Thickness[0.002], 
       PlotPoints -> 100, Frame -> None, Contours -> Range[-1, 7, 0.5], 
       AspectRatio -> 4/(3 Pi), PlotRangePadding -> 0], 
      ContourPlot[y^2 - Cos[x] == 1, {x, -3 Pi, 3 Pi}, {y, -2.5, 2.5}, 
       ContourShading -> None, ContourStyle -> Thickness[0.004], 
       PlotPoints -> 200, Frame -> None, AspectRatio -> 4/(3 Pi), 
       PlotRangePadding -> 0],
      
      Graphics[{Black, Arrowheads[ah], Thickness[0.0001], 
        Arrow[#] & /@ lstAr1, Arrow[#] & /@ lstAr2, 
        Arrow[#] & /@ lstAr3}], 
      Graphics[Append[
        Point[#] & /@ {{0, 0}, {Pi, 0}, {-Pi, 0}, {2 Pi, 0}, {-2 Pi, 0}}, 
        PointSize[ps1]]],
      
      Graphics[{Red, PointSize[ps2], 
        Point[#] & /@ (Join[lstAr1, lstAr2, lstAr3] /. {x_, y_} -> 
             y /. {x_, y_} -> If[y > 0, {x - eps, y}, {x + eps, y}])}], 
      Graphics[{Text[Style[0, textsize], {0, -0.4}], 
        Text[Style[\[Pi], textsize], {Pi, -0.4}], 
        Text[Style[-\[Pi], textsize], {-Pi, -0.4}], 
        Text[Style[2 \[Pi], textsize], {2 Pi, -0.4}], 
        Text[Style[-2 \[Pi], textsize], {-2 Pi, -0.4}]}], 
      ImageSize -> 500]]

enter image description here

Source Link
Alexei Boulbitch
  • 40k
  • 2
  • 48
  • 100

If you need to show the points at the arrow tips, you should specify them separately from the specification of arrows. The points coordinates may be obtained from those of the arrows. Try this:

     textsize = 16;
ah = 0.03;
ps1 = 0.5;
ps2 = 0.01;
lstAr1 = {{{0.0, Sqrt[2]}, {0.35, 
     Sqrt[2]}}, {{-0.1, -Sqrt[2]}, {-0.35, -Sqrt[2]}}, {{2 Pi + 0.1, 
     Sqrt[2]}, {2 Pi + 0.35, 
     Sqrt[2]}}, {{2 Pi - 0.1, -Sqrt[2]}, {2 Pi - 
      0.35, -Sqrt[2]}}, {{-2 Pi + 0.1, Sqrt[2]}, {-2 Pi + 0.35, 
     Sqrt[2]}}, {{-2 Pi - 0.1, -Sqrt[2]}, {-2 Pi - 0.35, -Sqrt[2]}}};
lstAr2 = {{{0, 1}, {0.2, 1}}, {{-0, -1}, {-0.2, -1}}, {{2 Pi + 0.1, 
     1}, {2 Pi + 0.2, 
     1}}, {{2 Pi - 0.1, -1}, {2 Pi - 0.2, -1}}, {{-2 Pi + 0.1, 
     1}, {-2 Pi + 0.2, 1}}, {{-2 Pi - 0.1, -1}, {-2 Pi - 0.2, -1}}};
lstAr3 = {{{0.1, 1.87}, {0.2, 
     1.87}}, {{-0.1, -1.87}, {-0.2, -1.87}}, {{2 Pi + 0.1, 
     1.87}, {2 Pi + 0.2, 
     1.87}}, {{2 Pi - 0.1, -1.87}, {2 Pi - 0.2, -1.87}}, {{-2 Pi + 
      0.1, 1.87}, {-2 Pi + 0.2, 
     1.87}}, {{-2 Pi - 0.1, -1.87}, {-2 Pi - 0.2, -1.87}}};

Framed[Show[
  ContourPlot[y^2 - Cos[x], {x, -3 Pi, 3 Pi}, {y, -2.5, 2.5}, 
   ContourShading -> None, ContourStyle -> Thickness[0.002], 
   PlotPoints -> 100, Frame -> None, Contours -> Range[-1, 7, 0.5], 
   AspectRatio -> 4/(3 Pi), PlotRangePadding -> 0], 
  ContourPlot[y^2 - Cos[x] == 1, {x, -3 Pi, 3 Pi}, {y, -2.5, 2.5}, 
   ContourShading -> None, ContourStyle -> Thickness[0.004], 
   PlotPoints -> 200, Frame -> None, AspectRatio -> 4/(3 Pi), 
   PlotRangePadding -> 0],
  
  Graphics[{Black, Arrowheads[ah], Thickness[0.0001], 
    Arrow[#] & /@ lstAr1, Arrow[#] & /@ lstAr2, 
    Arrow[#] & /@ lstAr3}], 
  Graphics[Append[
    Point[#] & /@ {{0, 0}, {Pi, 0}, {-Pi, 0}, {2 Pi, 0}, {-2 Pi, 0}}, 
    PointSize[ps1]]],
  
  Graphics[{PointSize[ps2], 
    Point[#] & /@ (Join[lstAr1, lstAr2, lstAr3] /. {x_, y_} -> y)}], 
  Graphics[{Text[Style[0, textsize], {0, -0.4}], 
    Text[Style[\[Pi], textsize], {Pi, -0.4}], 
    Text[Style[-\[Pi], textsize], {-Pi, -0.4}], 
    Text[Style[2 \[Pi], textsize], {2 Pi, -0.4}], 
    Text[Style[-2 \[Pi], textsize], {-2 Pi, -0.4}]}], 
  ImageSize -> 500]]

yielding the following: enter image description here Here ah specifies the arrow heads size, ps1 - specifies the points sizes in the centers of the cycles and ps2 - those at the arrow tips. I tried to save it as PDF and it works.