deleted 6 characters in body
Source Link
F'x
  • 10.9k
  • 3
  • 52
  • 92

I'm trying to find out if it's possible to find the beat of a tune by Fourier analysis with Mathematica. I'm taking a 44.1 kHz sample sound and hoping that I might get a nice peak for a frequency somewhere in the window of reasonable bpm (so, 60 to 100 per minute).

s = Import["Eleanorrigbylive.wav"];
raw = First@First@First@s;
avg = Table[Mean[Abs /@ raw[[i ;; i + 127]]], {i, 1, Length@raw/128}];
avg = Drop[avg, Floor[Length@avg/10]];

So, I'm importing the raw data and storing one channel's samples into raw. Because 44.1 kHz is way to much for what I want to do, I downsample it by averaging over blocks of size 128, so avg corresponds to samples at 344.5 Hz (which should be enough for my measurement of a 1 to 2 Hz phenomenon). Then, I'm dropping the intro of the song :)

However, Fourier analysis in the expected window is more than disappointing:

ListLinePlot[
 MapIndexed[(First@#2)^2*#1 &, FourierDST@Take[avg][[1FourierDST@avg[[1 ;; 1000]]]]
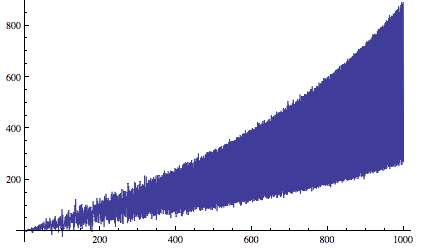
enter image description here

Thus, my questions are:

  • am I missing some Mathematica functionality which would not require me to do this the hard way?
  • is my analysis incorrect? how could I determine the beat of a sound sample?

I'm trying to find out if it's possible to find the beat of a tune by Fourier analysis with Mathematica. I'm taking a 44.1 kHz sample sound and hoping that I might get a nice peak for a frequency somewhere in the window of reasonable bpm (so, 60 to 100 per minute).

s = Import["Eleanorrigbylive.wav"];
raw = First@First@First@s;
avg = Table[Mean[Abs /@ raw[[i ;; i + 127]]], {i, 1, Length@raw/128}];
avg = Drop[avg, Floor[Length@avg/10]];

So, I'm importing the raw data and storing one channel's samples into raw. Because 44.1 kHz is way to much for what I want to do, I downsample it by averaging over blocks of size 128, so avg corresponds to samples at 344.5 Hz (which should be enough for my measurement of a 1 to 2 Hz phenomenon). Then, I'm dropping the intro of the song :)

However, Fourier analysis in the expected window is more than disappointing:

ListLinePlot[
 MapIndexed[(First@#2)^2*#1 &, FourierDST@Take[avg][[1 ;; 1000]]]]

enter image description here

Thus, my questions are:

  • am I missing some Mathematica functionality which would not require me to do this the hard way?
  • is my analysis incorrect? how could I determine the beat of a sound sample?

I'm trying to find out if it's possible to find the beat of a tune by Fourier analysis with Mathematica. I'm taking a 44.1 kHz sample sound and hoping that I might get a nice peak for a frequency somewhere in the window of reasonable bpm (so, 60 to 100 per minute).

s = Import["Eleanorrigbylive.wav"];
raw = First@First@First@s;
avg = Table[Mean[Abs /@ raw[[i ;; i + 127]]], {i, 1, Length@raw/128}];
avg = Drop[avg, Floor[Length@avg/10]];

So, I'm importing the raw data and storing one channel's samples into raw. Because 44.1 kHz is way to much for what I want to do, I downsample it by averaging over blocks of size 128, so avg corresponds to samples at 344.5 Hz (which should be enough for my measurement of a 1 to 2 Hz phenomenon). Then, I'm dropping the intro of the song :)

However, Fourier analysis in the expected window is more than disappointing:

ListLinePlot[
 MapIndexed[(First@#2)^2*#1 &, FourierDST@avg[[1 ;; 1000]]]]

enter image description here

Thus, my questions are:

  • am I missing some Mathematica functionality which would not require me to do this the hard way?
  • is my analysis incorrect? how could I determine the beat of a sound sample?
Tweeted twitter.com/#!/StackMma/status/191483019138301952
Source Link
F'x
  • 10.9k
  • 3
  • 52
  • 92

Can one find the beat of a tune with Fourier analysis?

I'm trying to find out if it's possible to find the beat of a tune by Fourier analysis with Mathematica. I'm taking a 44.1 kHz sample sound and hoping that I might get a nice peak for a frequency somewhere in the window of reasonable bpm (so, 60 to 100 per minute).

s = Import["Eleanorrigbylive.wav"];
raw = First@First@First@s;
avg = Table[Mean[Abs /@ raw[[i ;; i + 127]]], {i, 1, Length@raw/128}];
avg = Drop[avg, Floor[Length@avg/10]];

So, I'm importing the raw data and storing one channel's samples into raw. Because 44.1 kHz is way to much for what I want to do, I downsample it by averaging over blocks of size 128, so avg corresponds to samples at 344.5 Hz (which should be enough for my measurement of a 1 to 2 Hz phenomenon). Then, I'm dropping the intro of the song :)

However, Fourier analysis in the expected window is more than disappointing:

ListLinePlot[
 MapIndexed[(First@#2)^2*#1 &, FourierDST@Take[avg][[1 ;; 1000]]]]

enter image description here

Thus, my questions are:

  • am I missing some Mathematica functionality which would not require me to do this the hard way?
  • is my analysis incorrect? how could I determine the beat of a sound sample?