Here's another way using hidden functions that returns the plot range + padding...
Charting`get3DPlotRange @ Graphics3D[{}]
(*
   {{-1.04167, 1.04167}, {-1.04167, 1.04167}, {-1.04167, 1.04167}}
*)


Charting`get2DPlotRange @ Plot[Sin[x], {x, 0, 6}]
(*
   {{-0.12, 6.12}, {-1.04, 1.04}}
*)
The second argument of Charting`get2DPlotRange specifies whether padding should be calculated or not. Here, padding is ignored:
Charting`get2DPlotRange[Plot[Sin[x], {x, 0, 6}], False]
(*
   {{0, 6}, {-1., 1.}}
*)
...except that Charting`get2DPlotRange doesn't work on simple Graphics[{}] -- either of the OP's examples.
Charting`get2DPlotRange@Graphics[{}]
(*
   {{-0.02, 1.02}, {-0.02, 1.02}}
*)

Charting`get2DPlotRange@
 Graphics[{FaceForm[], EdgeForm[Black],
   GeometricTransformation[Rectangle[], RotationTransform[Pi/4]], Red,
    Point[{2, 2}]}, Frame -> True]
(*
   {{-0.02, 1.02}, {-0.02, 1.02}}
*)
But Charting`get3DPlotRange seems more reliable (so far):
SeedRandom[1];
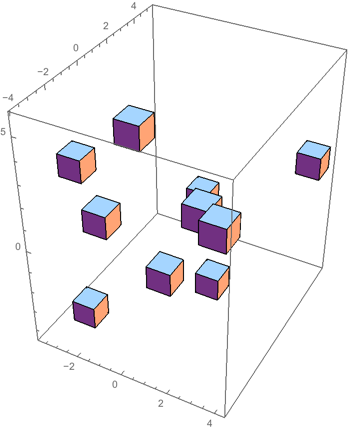
g = Graphics3D[{Translate[Cuboid[], RandomReal[{-5, 5}, {10, 3}]]}, Axes -> True]
Charting`get3DPlotRange[g]

(*
   {{-3.8777, 4.41753}, {-4.07619, 5.44314}, {-4.55333, 5.98243}}
*)
