Update:
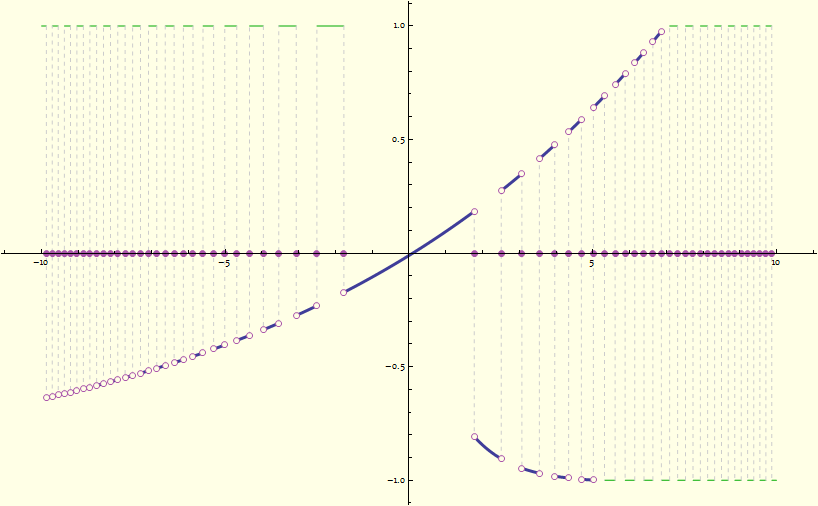
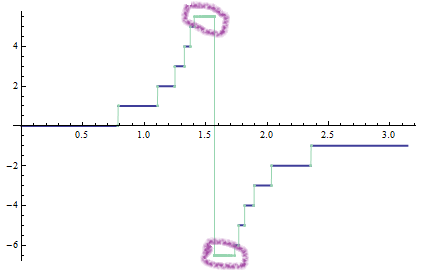
To overcome the issue I mention in the comment, also to make it more general, here is an upgraded version, which can deal with clipping and pointwise exclusion, and preserve styles specified in the original plot.
The main function is this discontinuousHighlighter:
Clear[discontinuousHighlighter]
discontinuousHighlighter[origplot_, {excluMarker_, clipMarker_}, radius_: 3] :=
 Module[{clipIntvX, black = Black, white, edgestyle},
        edgestyle = {AbsoluteThickness[1], black};
        white = If[# === None, White, #] &[Background /. AbsoluteOptions[origplot, Background]];
        (* clipped intervals: *)
        clipIntvX = Interval @@ Join @@ Cases[origplot,
                        {style___,lines:Longest[Line[_]..],___}/;Not[FreeQ[{style}, clipMarker]]:>{lines}[[All,1,All,1]],
                                              ∞];
        origplot /.
            (* exclusion boundary markers on curve: *)
            {style___, Point[pts__]} /; Not[FreeQ[{style}, excluMarker]] :>
             (black = If[# === {}, black, #[[-1]]] &@
                          DeleteCases[Cases[{style}, (RGBColor | Hue)[__], ∞], excluMarker];
              edgestyle = Join[edgestyle, {style /. Directive | EdgeForm -> Sequence} // Flatten];
              Flatten[{
                       EdgeForm[edgestyle],
                       FaceForm[white],
                       Module[{pt = #},
                              If[IntervalMemberQ[clipIntvX, pt[[1]]],
                                 {},
                                 Disk[pt, Offset[radius]]
                                ]
                          ] & /@ pts} /. excluMarker -> Sequence[]]
             ) /.
           (* exclusion markers on x axis: *)
           {style___, lines : (Line[_] ..)} /; FreeQ[{style}, clipMarker] && Not[FreeQ[{style}, excluMarker]] :>
            Join[
                 {style, lines} /. excluMarker -> Sequence[],
                 Flatten[{
                          EdgeForm[edgestyle],
                          FaceForm[black],
                          Disk[{Mean[#[[All, 1]]], 0}, Offset[radius]] & @@@ {lines}
                         }] /. excluMarker -> black
                ] /.
          (* clipped interval: *)
          {style___,lines:Longest[Line[_]..],post___}/;Not[FreeQ[{style},clipMarker]]&&Not[FreeQ[{post},clipMarker]] :>
           ({style, lines} /. clipMarker -> Sequence[]) //
          Show[#, PlotRangeClipping -> False, PlotRangePadding -> Scaled[.05]] &
       ]
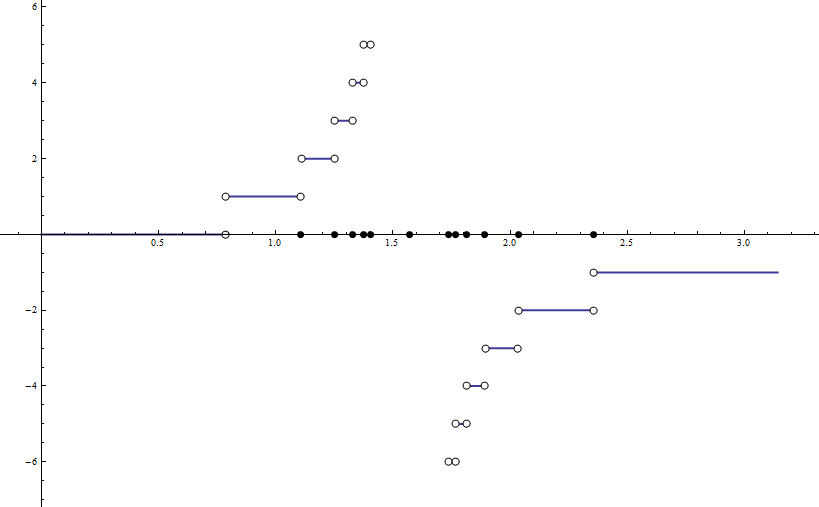
Basically, we calculate the x coordinates of the filled disks from the exclusion lines, and convert the endpoints on curve to hollow disks.
To use the function, wrap Plot[...] with it:
Module[{excluMarker = RGBColor @@ RandomReal[1, 3], clipMarker = RGBColor @@ RandomReal[1, 3]},
       discontinuousHighlighter[
                                Plot[Exp[(Ceiling[Sin[x^2]] - 9/10) x] - 1.01, {x, -10, 10},
                                     PlotStyle -> Directive[AbsoluteThickness[3]],
                                     PlotPoints -> 1000, MaxRecursion -> 15,
                                     PlotRange -> {-1, 1},
                                     ExclusionsStyle -> {
                                                         Directive[GrayLevel[.8], Dashed, excluMarker],
                                                         Directive[EdgeForm[{Lighter[Purple]}], excluMarker]
                                                        },
                                     ClippingStyle -> Directive[Darker[Green], Thin, clipMarker],
                                     Background -> Lighter[Yellow, .9]
                                    ],
                                {excluMarker, clipMarker},
                                3 ]
      ]

You can use any style in ExclusionsStyle and ClippingStyle. As long as they contain excluMarker and clipMarker, the result should be parsed correctly by discontinuousHighlighter. And hollow disks will automatically fit the background color.
Original answer:


