added 636 characters in body
Source Link
rm -rf
  • 89.3k
  • 21
  • 297
  • 479

Now use this definition to redefine DiracDelta inside a Block and you can use your original code with some slight modifications:

wb1 = Block[{DiracDelta = Piecewise[{{10000, # == 0}, {0, True}}] &}, 
  ListLinePlot[Re[eqn1wb] /. f -> # & /@ Range[-5, 5, 1/100], 
   DataRange -> {-5, 5}, PlotRange :> {All, {0, 1}}, 
   PlotStyle :> {Thick, Red}, AspectRatio :> 1, 
   GridLines :> {{-4, -2, 2, 4}, {1.0, 0.5, -0.5, -1.0}}, 
   PlotLabel :> "Re(w) - Frequency Response", 
   AxesLabel :> {"f", "W(f)"}]
  ]

enter image description here

If I were to haveuse a schematic to show the Diracdelta function schematically, I would do it similar to Sjoerd's arrow plots.

If I were to have to show the Dirac function schematically, I would do it similar to Sjoerd's arrow plots.

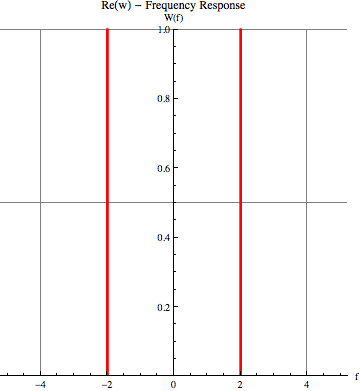
Now use this definition to redefine DiracDelta inside a Block and you can use your original code with some slight modifications:

wb1 = Block[{DiracDelta = Piecewise[{{10000, # == 0}, {0, True}}] &}, 
  ListLinePlot[Re[eqn1wb] /. f -> # & /@ Range[-5, 5, 1/100], 
   DataRange -> {-5, 5}, PlotRange :> {All, {0, 1}}, 
   PlotStyle :> {Thick, Red}, AspectRatio :> 1, 
   GridLines :> {{-4, -2, 2, 4}, {1.0, 0.5, -0.5, -1.0}}, 
   PlotLabel :> "Re(w) - Frequency Response", 
   AxesLabel :> {"f", "W(f)"}]
  ]

enter image description here

If I were to use a schematic to show the delta function, I would do it similar to Sjoerd's arrow plots.

added 1095 characters in body
Source Link
rm -rf
  • 89.3k
  • 21
  • 297
  • 479

The Dirac delta, $\delta(x)$ is zero everywhere except at zero, and has an integral of 1 over $\mathbb{R}$. It is not really a function in the true sense and equating $\delta(0)=\infty$ is a rather loose definition; it should technically be considered as a distribution or a delta measure. Mathematica's implementation of DiracDelta remains unevaluated at 0 and has all the other properties.

DiracDelta /@ {-1, 0, 1}
Out[1]= {0, DiracDelta[0], 0}

Integrate[DiracDelta[x] , {x, -Infinity, Infinity}]
Out[2]= 1

This explains why you weren't getting any result with Plot.

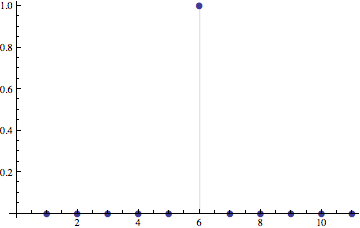
In the off-chance that you were trying to plot the impulse response of a discrete-time system, then you might be interested in the DiscreteDelta function:

ListPlot[DiscreteDelta /@ Range[-5, 5], Filling -> Axis, PlotMarkers -> {Automatic, 10}]

enter image description hereenter image description here


You can also reproduce your MATLAB "plot" of the Dirac delta function in Mathematica. Let me first note that you're not using their dirac() function to produce the output you've shown below. In fact, they define it "loosely":

function Y = dirac(X)
%DIRAC  Delta function.
%    DIRAC(X) is zero for all X, except X == 0 where it is infinite.
%    more comments

Y = zeros(size(X));
Y(X == 0) = Inf;

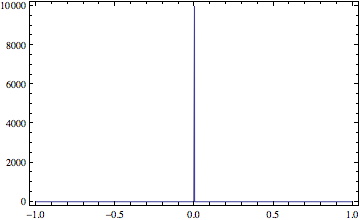
and this would not have given you the plot you showed, because of the Inf. You have probably replaced Inf with 10000 or written a similar function. Heike, image_doctor and Sjoerd have shown you ways of plotting it. You can also roll your own, a la MATLAB style as:

dirac[x_] := Piecewise[{{10000, x == 0}, {0, True}}]
ListLinePlot[{#, dirac@#} & /@ Range[-1, 1, 1/1000], Frame -> True, Axes -> False]

enter image description here

If I were to have to show the Dirac function schematically, I would do it similar to Sjoerd's arrow plots.

The Dirac delta, $\delta(x)$ is zero everywhere except at zero, and has an integral of 1 over $\mathbb{R}$. It is not really a function in the true sense and equating $\delta(0)=\infty$ is a rather loose definition; it should technically be considered as a distribution or a delta measure. Mathematica's implementation of DiracDelta remains unevaluated at 0 and has all the other properties.

DiracDelta /@ {-1, 0, 1}
Out[1]= {0, DiracDelta[0], 0}

Integrate[DiracDelta[x] , {x, -Infinity, Infinity}]
Out[2]= 1

This explains why you weren't getting any result with Plot.

In the off-chance that you were trying to plot the impulse response of a discrete-time system, then you might be interested in the DiscreteDelta function:

ListPlot[DiscreteDelta /@ Range[-5, 5], Filling -> Axis, PlotMarkers -> {Automatic, 10}]
enter image description here


You can also reproduce your MATLAB "plot" of the Dirac delta function in Mathematica. Let me first note that you're not using their dirac() function to produce the output you've shown below. In fact, they define it "loosely":

function Y = dirac(X)
%DIRAC  Delta function.
%    DIRAC(X) is zero for all X, except X == 0 where it is infinite.
%    more comments

Y = zeros(size(X));
Y(X == 0) = Inf;

and this would not have given you the plot you showed, because of the Inf. You have probably replaced Inf with 10000 or written a similar function. Heike, image_doctor and Sjoerd have shown you ways of plotting it. You can also roll your own, a la MATLAB style as:

dirac[x_] := Piecewise[{{10000, x == 0}, {0, True}}]
ListLinePlot[{#, dirac@#} & /@ Range[-1, 1, 1/1000], Frame -> True, Axes -> False]
enter image description here

If I were to have to show the Dirac function schematically, I would do it similar to Sjoerd's arrow plots.
added 404 characters in body
Source Link
rm -rf
  • 89.3k
  • 21
  • 297
  • 479

The Dirac delta, $\delta(x)$ is zero everywhere except at zero, and has an integral of 1 over $\mathbb{R}$. However,It is not really a function in the true sense and equating $\delta(0)=\infty$ is a rather loose definition anddefinition; it should technically be considered as a distribution or a delta measure.

  Mathematica's implementation of DiracDelta remains unevaluated at 0 and has all the other properties.

DiracDelta /@ {-1, 0, 1}
Out[1]= {0, DiracDelta[0], 0}

Integrate[DiracDelta[x] , {x, -Infinity, Infinity}]
Out[2]= 1

This explains why you weren't getting any result with Plot.

In the off-chance that you were trying to plot the impulse response of a discrete-time system, then you might be interested in the DiscreteDelta function:

ListPlot[DiscreteDelta /@ Range[-5, 5], Filling -> Axis, PlotMarkers -> {Automatic, 10}]

enter image description here

The Dirac delta, $\delta(x)$ is zero everywhere except at zero, and has an integral of 1 over $\mathbb{R}$. However, equating $\delta(0)=\infty$ is a rather loose definition and should be considered as a distribution or a delta measure.

  Mathematica's implementation of DiracDelta remains unevaluated at 0 and has all the other properties.

DiracDelta /@ {-1, 0, 1}
Out[1]= {0, DiracDelta[0], 0}

Integrate[DiracDelta[x] , {x, -Infinity, Infinity}]
Out[2]= 1

The Dirac delta, $\delta(x)$ is zero everywhere except at zero, and has an integral of 1 over $\mathbb{R}$. It is not really a function in the true sense and equating $\delta(0)=\infty$ is a rather loose definition; it should technically be considered as a distribution or a delta measure. Mathematica's implementation of DiracDelta remains unevaluated at 0 and has all the other properties.

DiracDelta /@ {-1, 0, 1}
Out[1]= {0, DiracDelta[0], 0}

Integrate[DiracDelta[x] , {x, -Infinity, Infinity}]
Out[2]= 1

This explains why you weren't getting any result with Plot.

In the off-chance that you were trying to plot the impulse response of a discrete-time system, then you might be interested in the DiscreteDelta function:

ListPlot[DiscreteDelta /@ Range[-5, 5], Filling -> Axis, PlotMarkers -> {Automatic, 10}]

enter image description here

Source Link
rm -rf
  • 89.3k
  • 21
  • 297
  • 479
Loading