added 678 characters in body
Source Link
Yves Klett
  • 15.5k
  • 5
  • 58
  • 125

A slight rewrite of your code using Manipulate:

Manipulate[
 Column[{Show[px4, py4, 
    Graphics[{PointSize[Large], Red, Point[Dynamic[{t, x1[t]}]], 
      Point[Dynamic[{t, y1[t]}]]}]], 
   Show[ParametricPlot[{x1[t], y1[t]}, {t, 0, 5.375}, 
     AxesLabel -> {"Prey", "Predator"}, AspectRatio -> 1, 
     PlotRange -> {{0, 400}, {0, 80}}], 
    Graphics[{Red, PointSize[Large], Point[{x1[t], y1[t]}]}]]}, 
  Frame -> True], {t, 0, 21.5}]
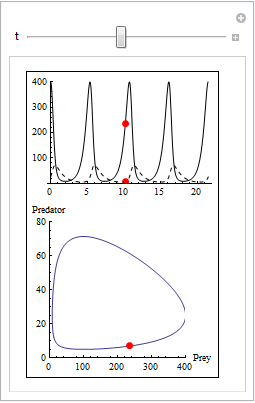
Mathematica graphics

You have different domains for your two Animates, but it somehow seems to work out in a cyclical fashion in this case.

As noted by @MichaelE2, a closer fit to the original Animate can be achieved in this way (layout changed to accomodate larger control bar):

Manipulate[
 Grid[{{Show[px4, py4, 
     Graphics[{PointSize[Large], Red, Point[Dynamic[{t, x1[t]}]], 
       Point[Dynamic[{t, y1[t]}]]}]], 
    Show[ParametricPlot[{x1[t], y1[t]}, {t, 0, 5.375}, 
      AxesLabel -> {"Prey", "Predator"}, AspectRatio -> 1, 
      PlotRange -> {{0, 400}, {0, 80}}], 
     Graphics[{Red, PointSize[Large], Point[{x1[t], y1[t]}]}]]}}, 
  Frame -> True], {t, 0, 21.5}, ControlType -> Animator]
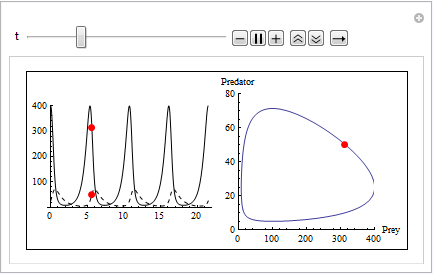
Mathematica graphics

A slight rewrite of your code using Manipulate:

Manipulate[
 Column[{Show[px4, py4, 
    Graphics[{PointSize[Large], Red, Point[Dynamic[{t, x1[t]}]], 
      Point[Dynamic[{t, y1[t]}]]}]], 
   Show[ParametricPlot[{x1[t], y1[t]}, {t, 0, 5.375}, 
     AxesLabel -> {"Prey", "Predator"}, AspectRatio -> 1, 
     PlotRange -> {{0, 400}, {0, 80}}], 
    Graphics[{Red, PointSize[Large], Point[{x1[t], y1[t]}]}]]}, 
  Frame -> True], {t, 0, 21.5}]

Mathematica graphics

You have different domains for your two Animates, but it somehow seems to work out in a cyclical fashion in this case.

As noted by @MichaelE2, a closer fit to the original Animate can be achieved in this way (layout changed to accomodate larger control bar):

Manipulate[
 Grid[{{Show[px4, py4, 
     Graphics[{PointSize[Large], Red, Point[Dynamic[{t, x1[t]}]], 
       Point[Dynamic[{t, y1[t]}]]}]], 
    Show[ParametricPlot[{x1[t], y1[t]}, {t, 0, 5.375}, 
      AxesLabel -> {"Prey", "Predator"}, AspectRatio -> 1, 
      PlotRange -> {{0, 400}, {0, 80}}], 
     Graphics[{Red, PointSize[Large], Point[{x1[t], y1[t]}]}]]}}, 
  Frame -> True], {t, 0, 21.5}, ControlType -> Animator]

Mathematica graphics

added 2 characters in body
Source Link
Yves Klett
  • 15.5k
  • 5
  • 58
  • 125

A slight rewrite of your code using Manipulate:

Manipulate[
 Column[{Show[px4, py4, 
    Graphics[{PointSize[Large], Red, Point[Dynamic[{t, x1[t]}]], 
      Point[Dynamic[{t, y1[t]}]]}]], 
   Show[ParametricPlot[{x1[t], y1[t]}, {t, 0, 5.375}, 
     AxesLabel -> {"Prey", "Predator"}, AspectRatio -> 1, 
     PlotRange -> {{0, 400}, {0, 80}}], 
    Graphics[{Red, PointSize[Large], Point[{x1[t], y1[t]}]}]]}, 
  Frame -> True], {t, 0, 21.5}]

Mathematica graphics

You have different domains for your two Animates, but it somehow seems to work out in a cyclical fashion in this case.

A slight rewrite of your code using Manipulate:

Manipulate[
 Column[{Show[px4, py4, 
    Graphics[{PointSize[Large], Red, Point[Dynamic[{t, x1[t]}]], 
      Point[Dynamic[{t, y1[t]}]]}]], 
   Show[ParametricPlot[{x1[t], y1[t]}, {t, 0, 5.375}, 
     AxesLabel -> {"Prey", "Predator"}, AspectRatio -> 1, 
     PlotRange -> {{0, 400}, {0, 80}}], 
    Graphics[{Red, PointSize[Large], Point[{x1[t], y1[t]}]}]]}, 
  Frame -> True], {t, 0, 21.5}]

Mathematica graphics

You have different domains for your two Animates, but it somehow seems to work out in cyclical fashion in this case.

A slight rewrite of your code using Manipulate:

Manipulate[
 Column[{Show[px4, py4, 
    Graphics[{PointSize[Large], Red, Point[Dynamic[{t, x1[t]}]], 
      Point[Dynamic[{t, y1[t]}]]}]], 
   Show[ParametricPlot[{x1[t], y1[t]}, {t, 0, 5.375}, 
     AxesLabel -> {"Prey", "Predator"}, AspectRatio -> 1, 
     PlotRange -> {{0, 400}, {0, 80}}], 
    Graphics[{Red, PointSize[Large], Point[{x1[t], y1[t]}]}]]}, 
  Frame -> True], {t, 0, 21.5}]

Mathematica graphics

You have different domains for your two Animates, but it somehow seems to work out in a cyclical fashion in this case.

Source Link
Yves Klett
  • 15.5k
  • 5
  • 58
  • 125

A slight rewrite of your code using Manipulate:

Manipulate[
 Column[{Show[px4, py4, 
    Graphics[{PointSize[Large], Red, Point[Dynamic[{t, x1[t]}]], 
      Point[Dynamic[{t, y1[t]}]]}]], 
   Show[ParametricPlot[{x1[t], y1[t]}, {t, 0, 5.375}, 
     AxesLabel -> {"Prey", "Predator"}, AspectRatio -> 1, 
     PlotRange -> {{0, 400}, {0, 80}}], 
    Graphics[{Red, PointSize[Large], Point[{x1[t], y1[t]}]}]]}, 
  Frame -> True], {t, 0, 21.5}]

Mathematica graphics

You have different domains for your two Animates, but it somehow seems to work out in cyclical fashion in this case.