The idea is to use ListPlot3D with DataRange->All. But to use this, I needed to modify my data structure a little to make each entry in the list as {x,time,u(x,t)}. Not a big problem for me to do that. FollowingThe following diagram shows the data structure used
and the codeCode: (just for illustration of the method)
makeMake up the data:
f1 = .05;
f2 = .2;
simulationTime = 20;
u = Table[

       Table[{x,t,Exp[-.01 t] Cos[f1 t x] Sin[ f2 t x]},{x,-2 Pi,2 Pi,.2}],

       {t, 0, simulationTime, .1}
    ];
doDo the animation:
note(1)Note:
Just an implementation note. I have been testing the above method in my main demo, and so far, it is working well. But since I need to save in memory each frame to get this method to work (each time I plot, I plot all the frames from t0t0 to current time, so I need to keep them all in memory), what I did is the following:
- prePre-allocate using Table
Tablethe slots for as many frames I need. - doDo not do generate a frame for each time step, as it will consume too much memory, and the demo will become too slow very quickly. So what I do is make one frame each N$n$ time steps, where N$n$ is something I am trying to decide a good value for, as it depends on the length of the simulation and the size of the grid and such. I try to make it show not less than 100 or so frames for the whole simulation time each time. This way, it runs fast, and the memory usage for this is kept low.
- In MatlabMATLAB, I did this differently, since MatlabMATLAB has a command called
holdon. (reference linkholdon). I wish Mathematica hashad such a command,command; it would make life so much easier. This command works like this: One can make a plot to the graphic window, and then sayholdonwhich means the next plot to the same window will not erase what is on the window but add to it whatever is being plotted. So, when I did this same simulation in MatlabMATLAB, I did not have to keep track myself of all the frames, but only the current one. This made the simulation much simpler, as me, the user did not need to manage and keep lots of frames in my own buffer, all the time and then re-plot them all each time.
allocate array for simulation frames
LOOP
    time = time + delt
    generate solution
    IF need to generate new plot  --- do this every N steps to save memory
      add current frame to buffer
      plot frames 1..current
    END IF
END LOOP
allocate array for simulation frames
LOOP
    time = time + delt
    generate solution
    IF need to generate new plot  --- do this every N steps to save memory
      add current frame to buffer
      plot frames 1..current
    END IF
END LOOP
In MatlabMATLAB, I would do
LOOP
    time = time + delt
    generate solution
    Plot current frame
    holdon
END LOOP
LOOP
    time = time + delt
    generate solution
    Plot current frame
    holdon
END LOOP
Update(1):
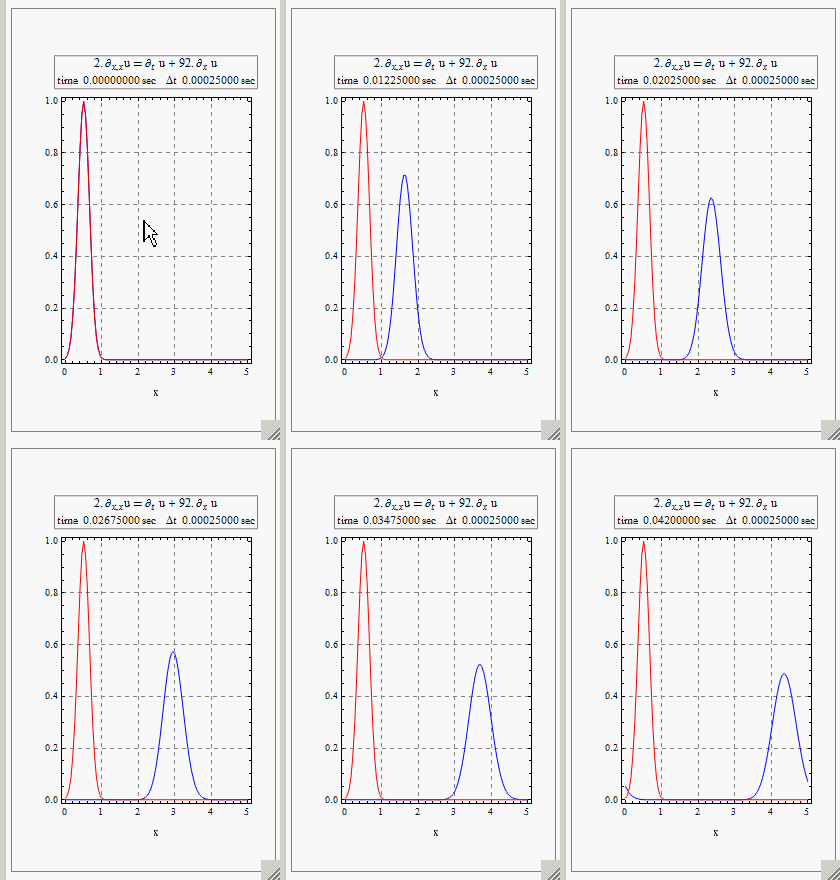
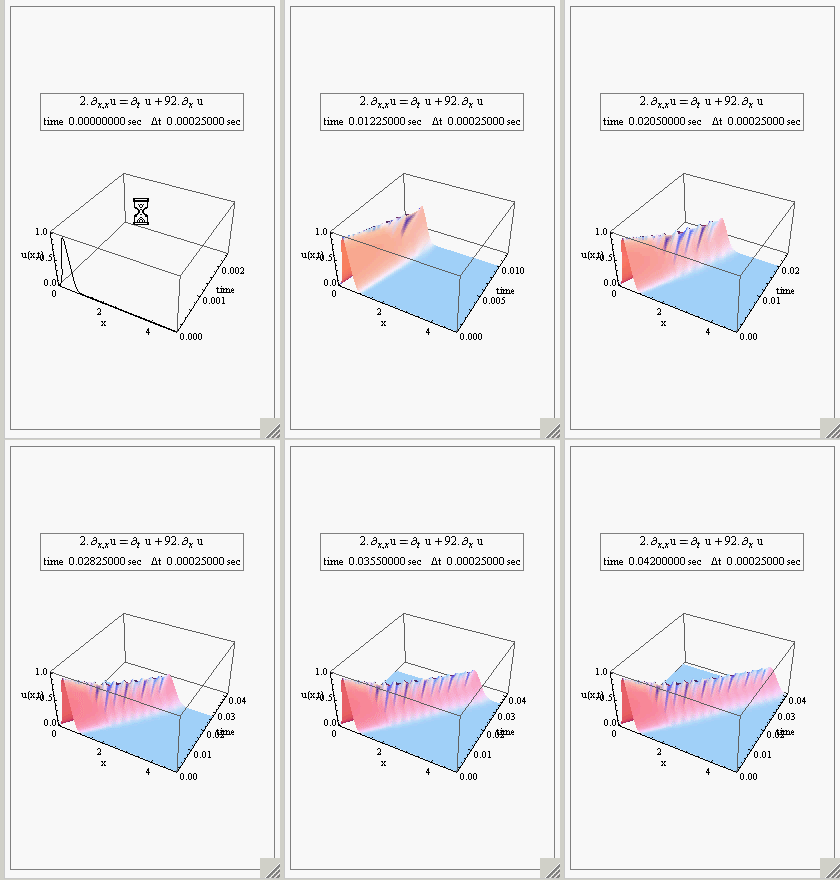
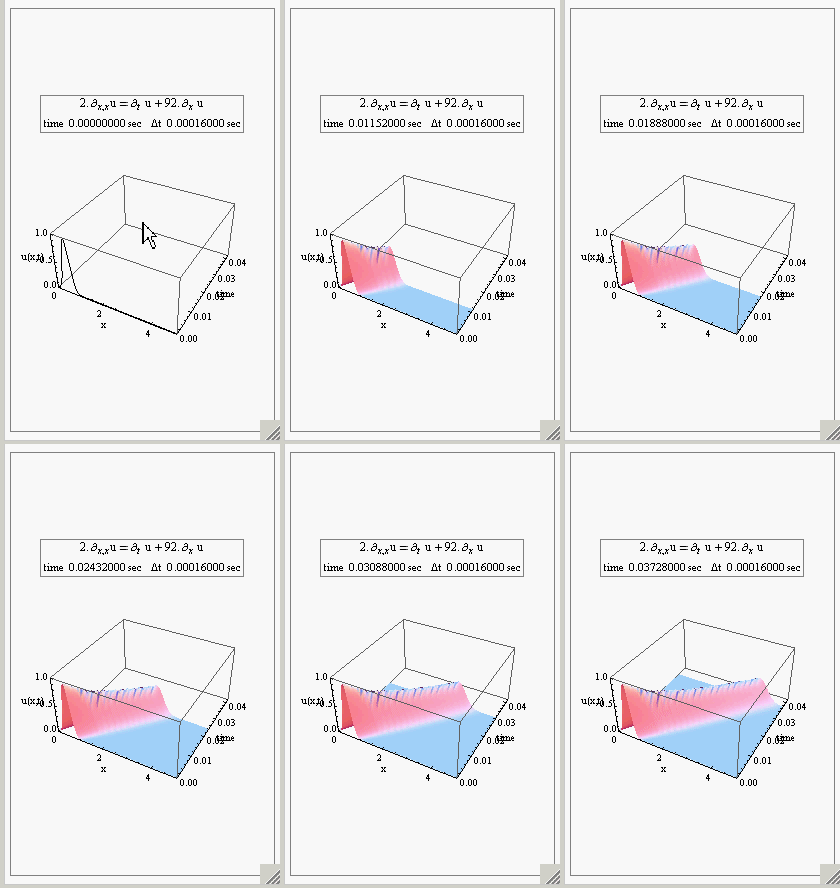
Here is one example, an animation of the solution of the convection-diffusion 1D pdePDE (diffusion with drift). In the 2D plot, the red curve is the initial condition, and the blue is the current concentration. Then the 3D view of the same solution.


