added 2 characters in body
Source Link

Take a look to the documentation page of Translate > NeatExamples. This example involves also Rotate.

In order to use it on "MoleculePlot" you have to extract the Graphics' first part, primitives, transform them and wrap with GraphicsGraphics3D`' first part (primitives), transform them and wrap with Graphics3D again:

p1 = ProteinData["A2M", "MoleculePlot"];
p2 = ProteinData["SERPINA1", "MoleculePlot"];

Show[
     p1,
     Graphics3D @ Translate[
        Rotate[First[p2], Pi/8, {1, 1, 0}], 
        {5, 5, 5}
     ]
    ]
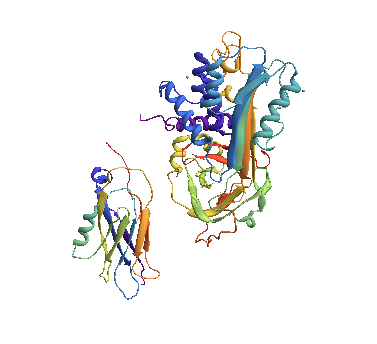
enter image description here

Take a look to the documentation page of Translate > NeatExamples. This example involves also Rotate.

In order to use it on "MoleculePlot" you have to extract the Graphics' first part, primitives, transform them and wrap with Graphics3D` again:

p1 = ProteinData["A2M", "MoleculePlot"];
p2 = ProteinData["SERPINA1", "MoleculePlot"];

Show[
     p1,
     Graphics3D @ Translate[
        Rotate[First[p2], Pi/8, {1, 1, 0}], 
        {5, 5, 5}
     ]
    ]

enter image description here

Take a look to the documentation page of Translate > NeatExamples. This example involves also Rotate.

In order to use it on "MoleculePlot" you have to extract the Graphics' first part (primitives), transform them and wrap with Graphics3D again:

p1 = ProteinData["A2M", "MoleculePlot"];
p2 = ProteinData["SERPINA1", "MoleculePlot"];

Show[
     p1,
     Graphics3D @ Translate[
        Rotate[First[p2], Pi/8, {1, 1, 0}], 
        {5, 5, 5}
     ]
    ]

enter image description here

added 37 characters in body
Source Link
Kuba
  • 137.7k
  • 13
  • 289
  • 751

Take a look to the documentation page of Translate > NeatExamples. This example involves also Rotate.

In order to use it on "MoleculePlot" you have to extract the graphics first part, graphics primitives, and the result wrapp with Graphics3DGraphics' first part, primitives, transform them and wrap with Graphics3D` again:

p1 = ProteinData["A2M", "MoleculePlot"];
p2 = ProteinData["SERPINA1", "MoleculePlot"];

Show[
     p1,
     Graphics3D@Translate[Rotate[First[p2]Graphics3D @ Translate[
        Rotate[First[p2], Pi/8, {1, 1, 0}], 
        {5, 5, 5}
     ]
    ]

enter image description here

Take a look to the documentation page of Translate > NeatExamples. This example involves also Rotate.

In order to use it on "MoleculePlot" you have to extract the graphics first part, graphics primitives, and the result wrapp with Graphics3D again:

p1 = ProteinData["A2M", "MoleculePlot"];
p2 = ProteinData["SERPINA1", "MoleculePlot"];

Show[
     p1,
     Graphics3D@Translate[Rotate[First[p2], Pi/8, {1, 1, 0}], {5, 5, 5}]
    ]

enter image description here

Take a look to the documentation page of Translate > NeatExamples. This example involves also Rotate.

In order to use it on "MoleculePlot" you have to extract the Graphics' first part, primitives, transform them and wrap with Graphics3D` again:

p1 = ProteinData["A2M", "MoleculePlot"];
p2 = ProteinData["SERPINA1", "MoleculePlot"];

Show[
     p1,
     Graphics3D @ Translate[
        Rotate[First[p2], Pi/8, {1, 1, 0}], 
        {5, 5, 5}
     ]
    ]

enter image description here

Source Link
Kuba
  • 137.7k
  • 13
  • 289
  • 751

Take a look to the documentation page of Translate > NeatExamples. This example involves also Rotate.

In order to use it on "MoleculePlot" you have to extract the graphics first part, graphics primitives, and the result wrapp with Graphics3D again:

p1 = ProteinData["A2M", "MoleculePlot"];
p2 = ProteinData["SERPINA1", "MoleculePlot"];

Show[
     p1,
     Graphics3D@Translate[Rotate[First[p2], Pi/8, {1, 1, 0}], {5, 5, 5}]
    ]

enter image description here