added edit2
Source Link

EDIT 2 Example:

You can download Mr Pointer's material-colors gamut data here: http://www.cis.rit.edu/mcsl/online/cie.php

This database is my source for the CIE x,y coordinates of the spctral colors at a resolution of 1 nm (the spectrum locus)

The most simple way to render spectra + white light at the maximal saturation (or highest chroma) level is pick a white light (either illuminant D75, D65, D50, or C, or anything else you have at your disposal...)

I take D65, which has normalized CIE XYZ coordinates:

X = 95.047
Y = 100
Z = 108.883

Then I take all the xy coordinates of the spectrum locus and I transform them in normalized XYZ with the Y value given by the Y colorimetric function multiplied by the D65 curve (so this is the D65 spectrum), and normalized at: Ymax = Y 555nm = 100

Finally, I average the two values (XYZ D65)*a and (XYZ locus)*b, with a, b being weighted such as the RGB conversion of the result will have: min R or/and min G or/and min B = 0 and max R or/and max G or/and max B = 255

That's the basic idea
made the image clickable
Source Link
Alexey Popkov
  • 62.3k
  • 7
  • 154
  • 375

spectra avg with white lightspectra avg with white light

spectra avg with white light

spectra avg with white light

add link to Nick Spiker's article
Source Link
Mr.Wizard
  • 273.1k
  • 34
  • 595
  • 1.4k

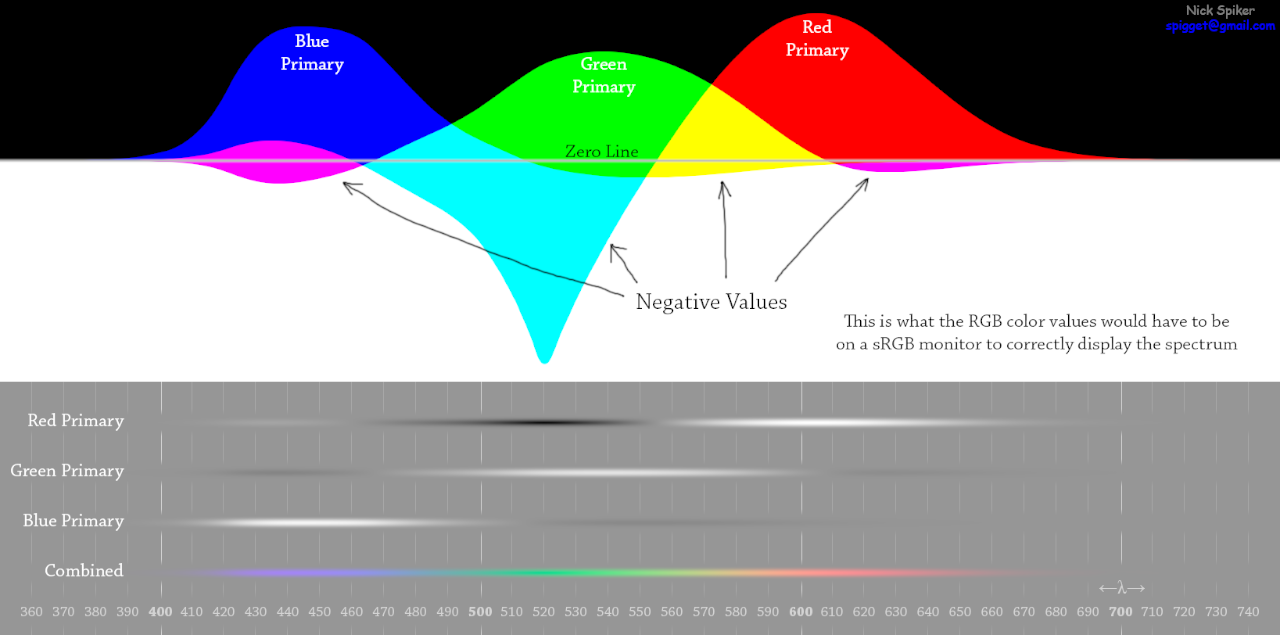
A better way I know to render the color spectra on a computer screen is to compute a mixture of white light + spectral colors, like this guy Nick SpikerNick Spiker did:

A better way I know to render the color spectra on a computer screen is to compute a mixture of white light + spectral colors, like this guy Nick Spiker did:

A better way I know to render the color spectra on a computer screen is to compute a mixture of white light + spectral colors, like this guy Nick Spiker did:

mixing 1st post and second
Source Link
Loading
Source Link
Loading